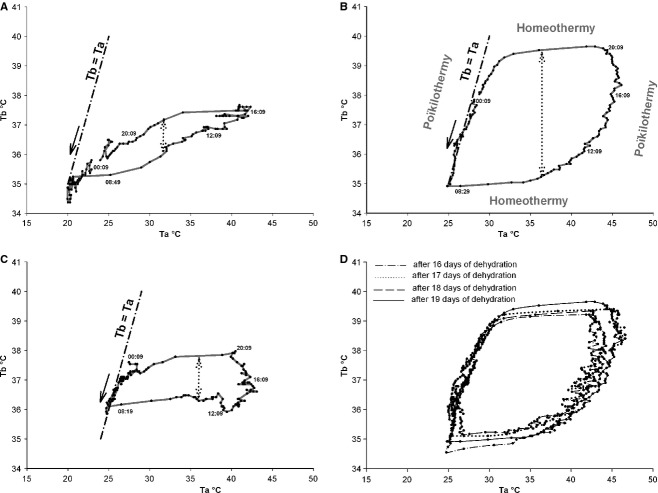
Figure 4.
Records of 24 h of Tb (solid line) from a camel H as function of Ta, during the last day of hydration period (A), the last day of dehydration period (B), throughout the first day of rehydration period (C), and over the last four consecutive days of dehydration period (D). Data were collected every 10 min. Dash‐dotted lines indicate the slope of identity line “Tb°C = Ta°C”. The dotted arrows show schematically the amplitude of the Tb rhythm. The direction of the black arrows indicates the course of time.

