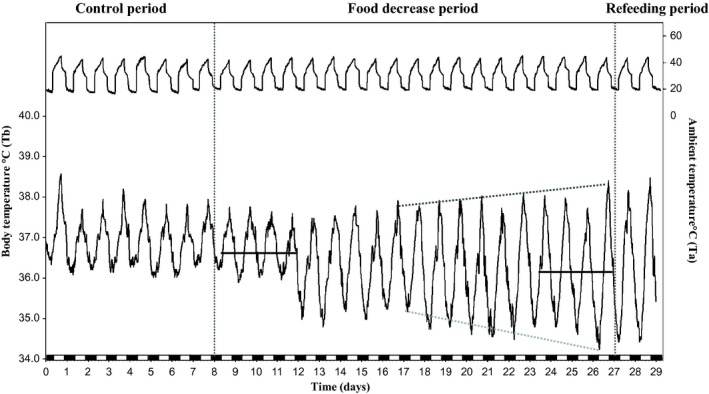
Figure 6.

Records of Tb from a camel (H) in experiment 2 (black line down). Data were collected every 10 min for 29 consecutive days. Ta is represented by the upper curve. The white and black blocks at the bottom of the figure denote the duration of the light and dark phases of the light–dark cycle, respectively. Dark gray and gray dotted lines represent the evolution of maximum en minimum of the Tb rhythm. Horizontal black lines indicate the mean of Tb during the first (36.74°C ± 0.02) and last 4 days of food decease period (36.16°C ± 0.04).
