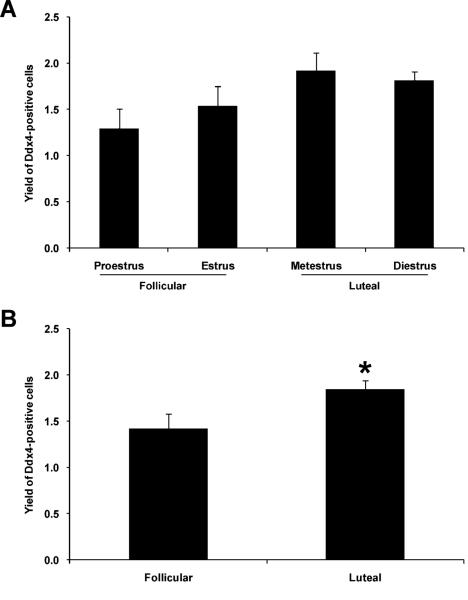
Figure 4.
Changes in OSC numbers in mouse ovaries relative to stage of the female reproductive cycle. (A, B) Yield of OSCs, as a percent of total viable cells sorted, from ovaries of adult female mice at each indicated stage of the estrous cycle (A) or following stratification of estrous cycle stages into the follicular and luteal phases of the ovarian cycle (B). The data shown represent the mean ± SEM (n = 3; *, P < 0.05).

