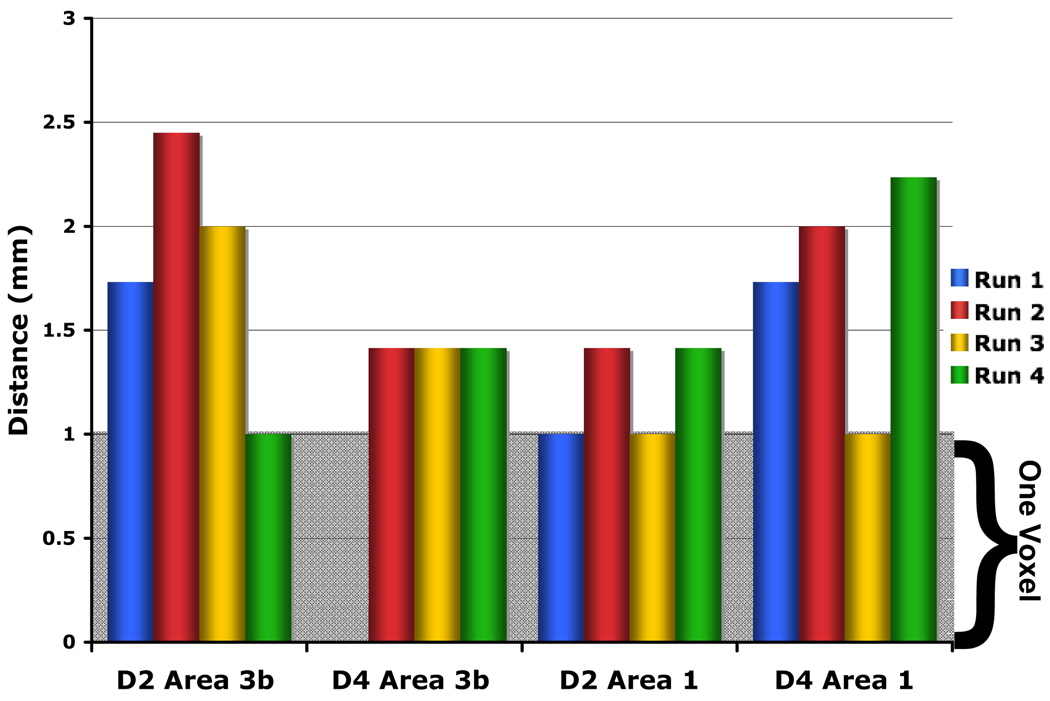
Figure 5. Center of mass displacement across runs.
The center of mass (COM) for each ROI was determined for a single run (as displayed in Figure 4) and for the mean. The displacement of single run COM from the mean COM was calculated. The grey shading represents the displacement by one voxel, 1 mm. The COM displacement was less than 2.5 mm for all runs within an ROI. Run 1 blue, Run 2 red, Run 3 yellow, and Run 4 green.

