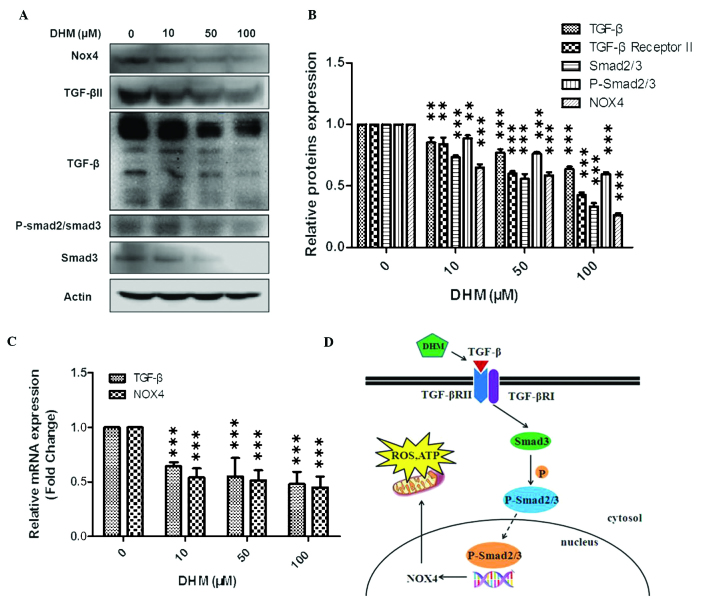
Figure 3.
Western blot analysis of the effects of DHM on mRNA and protein expression levels in Hepal-6 cells. (A) Western blot analysis of cells treated with various concentrations (10, 50 and 100 μM) of DHM for 48 h (representative of three independent experiments). (B) Column diagram for A. (C) Cells were treated with DHM (10, 50 and 100 μM) for 24 h and TGF-β and NOX4 mRNA expression were measured by quantitative polymerase chain reaction. The experiment was performed in triplicate. **P<0.01, ***P<0.001 vs. 0 μM DHM. Values are expressed as the mean ± standard deviation (D) Schematic of the suggested mechanism of action of DHM. DHM, dihydromyricetin; mRNA, messenger RNA; NOX4, NADPH oxidase 4; TGF-β, transforming growth factor-β; ROS, reactive oxygen species; ATP, adenosine triphosphate; TGF-βR, transforming growth factor-β receptor; p, phosphorylated.

