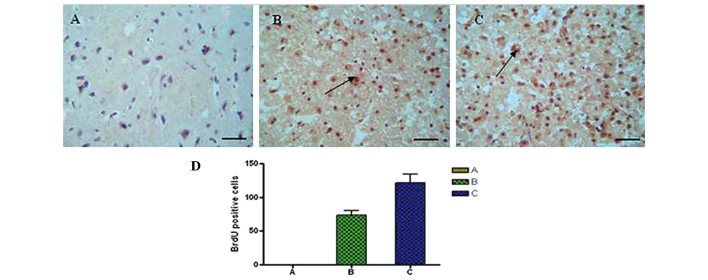
Figure 4.
Immunohistochemical staining showing the number of BrdU-positive cells in the SCI lesion tissues in rats in (A) Group A, (B) group B and (C) group C. (D) Graph displaying quantity of BrdU-positive cells in each group. By analysis of variance and Dunnett’s t-test comparison, the number of BrdU-positive cells in group C was found to be increased compared with group B (P<0.05) and group A (P<0.01). Arrows show BrdU-positive cells. Scale bar, 50 μm. BrDU, bromodeoxyuridine; SCI, spinal cord injury.

