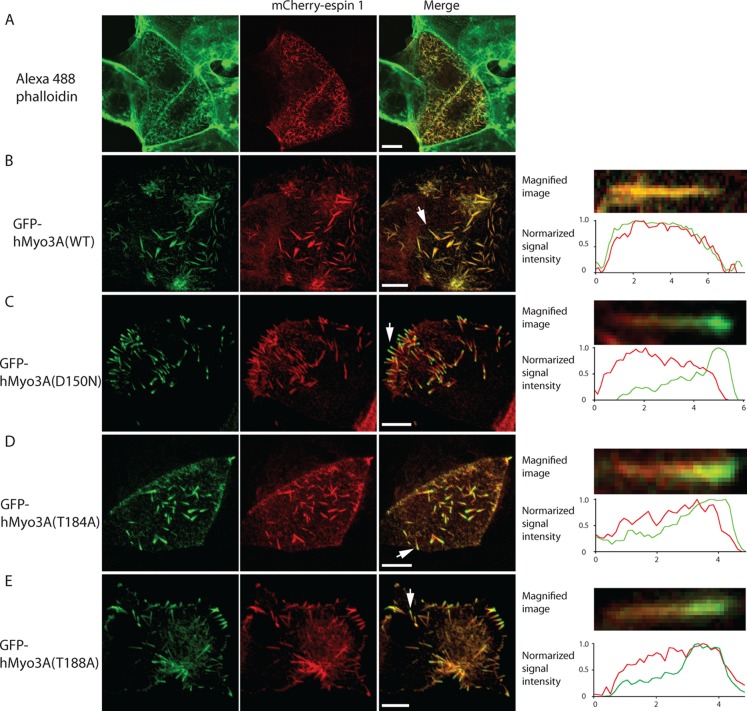
Figure 6.
Effect of hMyo3A on microvilli formation and localization of espin 1 and hMyo3A in microvilli. Caco2 cells were transfected with mCherry–espin 1 (A) or cotransfected with GFP–full length hMyo3A (GFP–hMyo3A) (B), GFP–hMyo3A(D150N) (C), GFP–hMyo3A(T184A) (D), or GFP–hMyo3A (T188A) (E). (left) Alexa-568 phalloidin staining (A) or GFP–hMyo3A constructs (B–F); (middle) mCherry–espin 1; (right) merged images. Right panels show representative magnified images of microvilli. Normalized signal intensities of GFP and mCherry along the microvilli are also shown in the lower panels.

