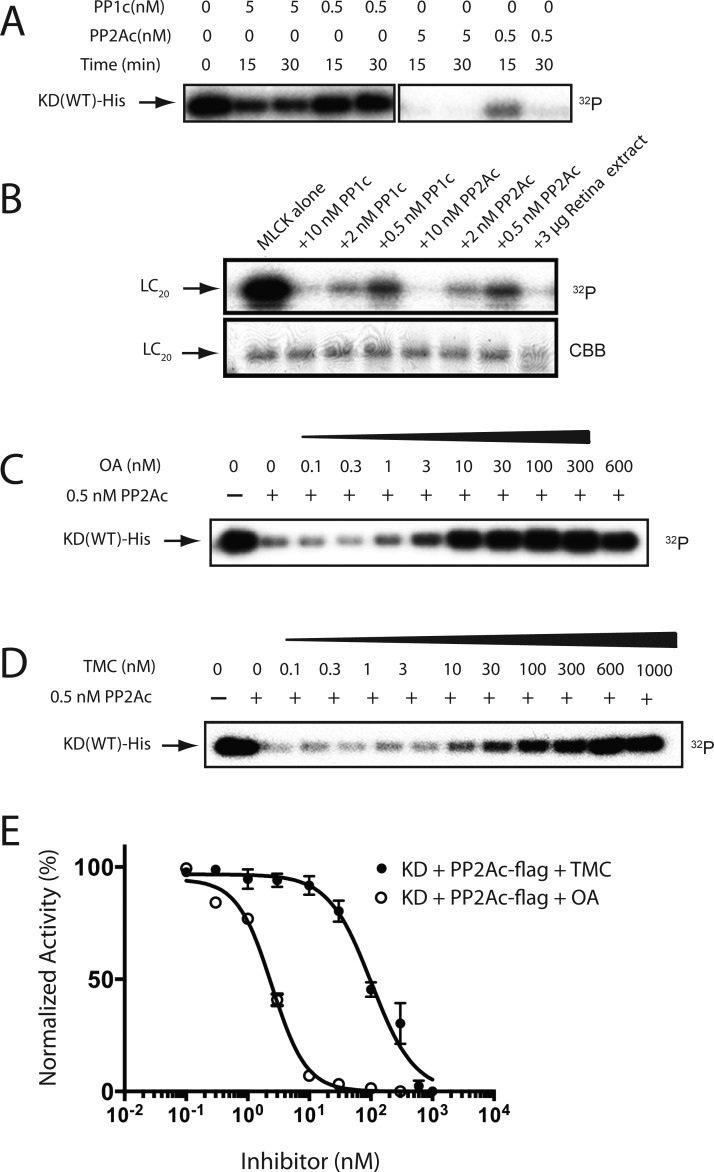
Figure 8.
Dephosphorylation of hMyo3A-KD by isolated PPases. (A) Dephopshorylatipon of hMyo3A-KD by PP1c and PP2Ac. Decrease of 32P in 36 nM of phosphorylated-KD was monitored by autoradiography: (lane 1) P-KD alone; (lanes 2 and 3) P-KD with 5 nM of PP1c for 15 and 30 min, respectively; (lanes 4 and 5) P-KD with 0.5 nM of PP1c for 15 and 30 min, respectively; (lanes 6 and 7) P-KD with 5 nM of PP2Ac for 15 and 30 min, respectively; (lanes 8 and 9) P-KD with 0.5 nM of PP2Ac for 15 and 30 min, respectively. (B) Dephosphorylation of LC20 by PP1c and PP2Ac. Decrease of [32P] in 50 μg/mL of P-LC20 was monitored: (lane 1) P-LC20 alone; (lane 2) P-LC20 with 10 nM PP1c; (lane 3) P-LC20 with 2 nM PP1c, (lane 4) P-LC20 with 0.5 nM of PP1c; (lane 5) P-LC20 with 10 nM of PP2Ac; (lane 6) P-LC20 with 2 nM PP2Ac; (lane 7) P-LC20 with 0.5 nM PP2Ac; (lane 8) P-LC20 with 50 μg/mL of retina tissue extract. The reaction time was 30 min. The bottom panel indicates input stained with Coomassie Brilliant Blue R-250. (C) Inhibition of PP2Ac dependent dephosphorylation of hMyo3A-KD by various concentrations of OA: (lane 1) P-KD alone; (lanes 2–10) P-KD and 0.5 nM of PP2Ac in the presence of the indicated amount of OA. (D) Inhibition of PP2Ac dependent dephosphorylation of hMyo3A-KD by various concentration of TMC: (lane 1) P-KD alone; (lanes 2–12) P-KD dephosphorylated by 0.5 nM of PP2Ac with various TMC concentration indicated. (E) Inhibition of PP2Ac as a function of OA and TMC concentration. The graph represents mean ± SEM from three independent sets of experiments. The radioactive band was excised and subjected to Cerenkov counting. The value without PP2Ac was set as 100%.

