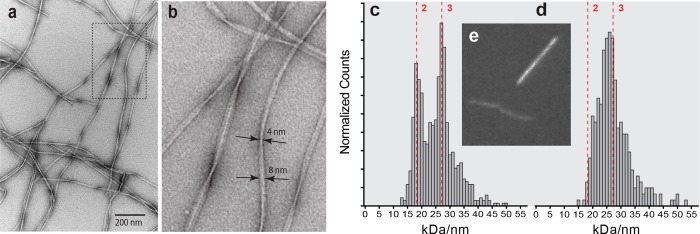
Figure 2.

(a) TEM images of Aβ40 fibrils negatively stained with ammonium molybdate (pH 7.4). (b) Five-fold magnification of the portion of panel a outlined in a dotted line, with measurements of a fibril at its widest (8 mm) and narrowest (4 mm) points. (c) MPL histogram (60 nm × 40 nm window, 685 measurements) of unstained TEM dark-field images of seeded Aβ40 fibrils. Dotted red vertical lines and integers represent the x-axis positions corresponding to two and three filaments per fibril. With windows that are 40 nm wide, there is a clear predominance of segments with either two or three filaments. (d) MPL histogram of the same images examined in panel c with a wider window (60 nm × 80 nm, 305 measurements). With the wider window, the same average MPL is obtained, but the two-filament and three-filament regions cannot be resolved. (e) Typical dark-field image with TMV (bright line) that serves as an internal mass standard for determining the MPL of a fibril (dim line).
