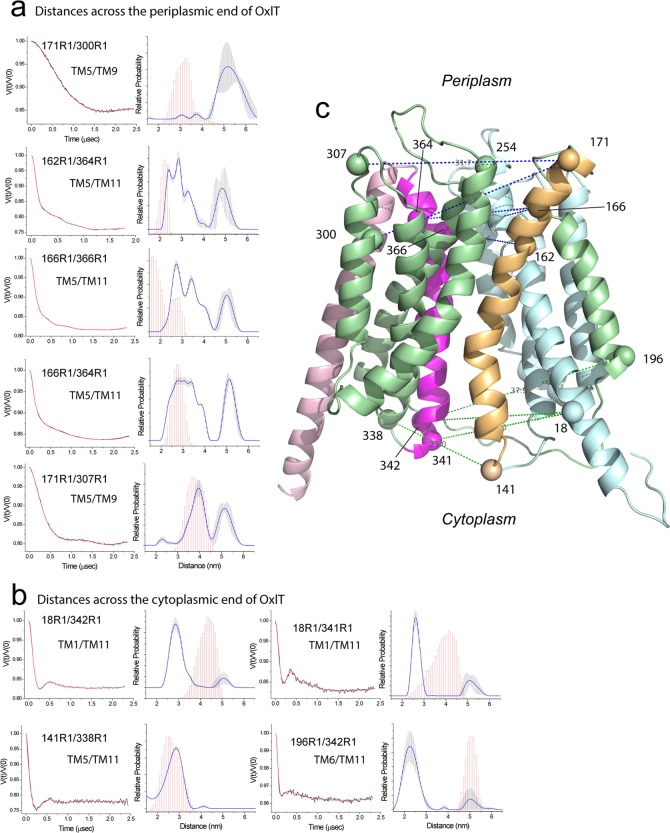
Figure 7.
Distances and distance distributions measured by double electron–electron resonance (DEER) for several spin pairs in OxlT. (a) Measurements across the periplasmic end of OxlT. The background-corrected DEER data is shown on the left (black traces) along with the fits to the data using a model-free approach (red traces). The distributions obtained are shown on the right, and an error range is indicated by the vertical error bars (shaded in gray) in the distribution. This error range is based on uncertainty in the background subtraction and dimensionality in the background form factor that produces fits within 15% of the RMSD of the best fits. These errors were obtained using the validation routine in DeerAnalysis. Shown in magenta are predictions of the distances and distance distributions based on the OxlT homology model using the PyMOL plug-in mtsslWizard.52 (b) Measurements across the cytoplasmic end of OxlT. (c) Homology model of OxlT along with the labeled sites used for DEER. Raw DEER data were processed and analyzed using the Matlab software package DEER Analysis.35

