
Figure 3.
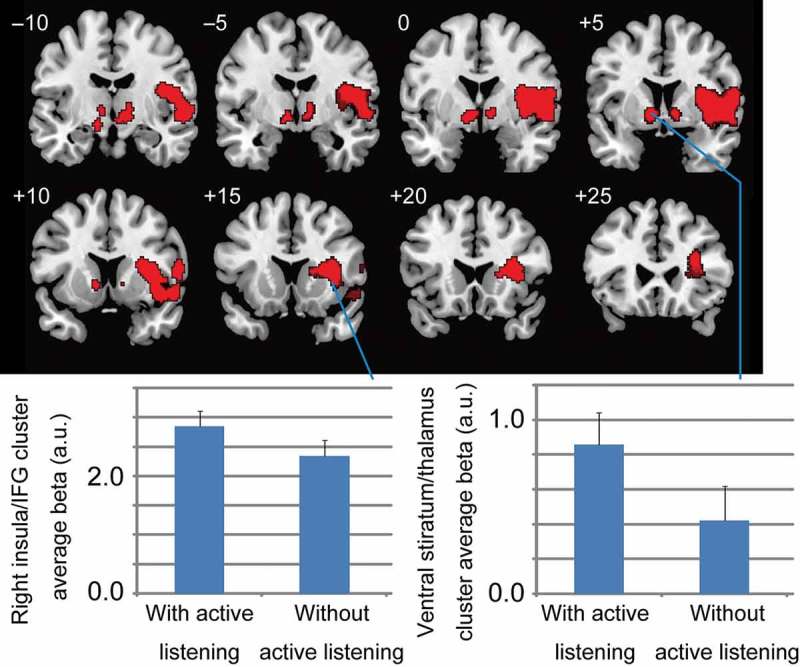
Significant activation during an ostensible evaluator’s assessment with active listening behavior compared to without active listening behavior. Thresholds were set at uncorrected p < .01 at the voxel level and false discovery rate (FDR) corrected p < .05 at the cluster level. Two significant activation clusters occurred: one in the insula and the right inferior frontal gyrus (IFG), and the other in the ventral striatum and thalamus. The lower half shows the average estimated beta values in the two significant clusters related to the two conditions (with and without active listening attitudes). The cluster average beta value was calculated using MarsBaR (http://marsbar.sourceforge.net). These bar-graphs are based on raw data and detail the significant activations.