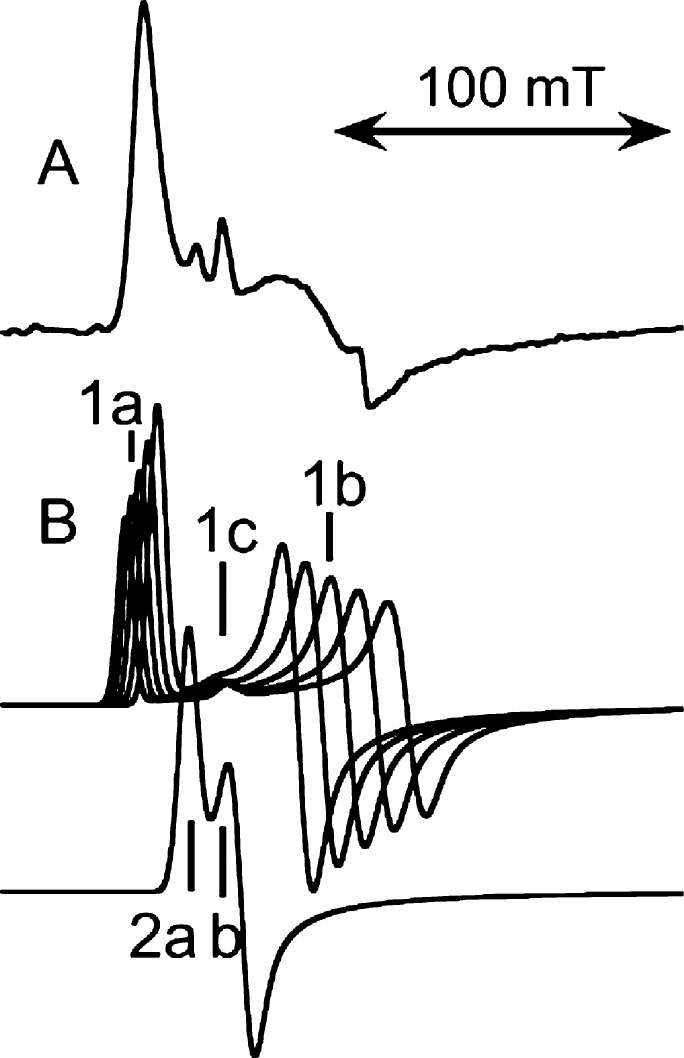
Figure 6.
Origin of lipoxygenase high-spin ferric, multicomponent EPR signals: (A) an experimental example from a bacterial lipoxygenase (PaLOX) and (B) corresponding components of calculated spectra. The distinguishing features labeled in the calculated 9.4 GHz spectra are at g-values 7.3 (1a), 5.86 (1c), ∼4.7 (1b), 6.3 (2a), and 5.86 (2b). Each of the calculated spectra labeled “1” represents the same number of spins and that labeled “2” has half that amount. A simulated spectrum is based on a distribution of amplitudes of the subspectra “1”. A simulation of the experimental spectrum of the lipoxygenase from Pseudomonas aeruginosa appears in ref (29).

