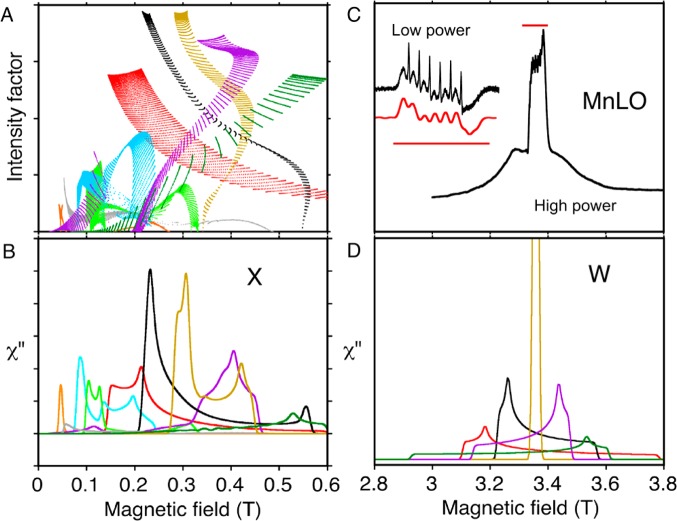
Figure 7.
Transitions contributing to EPR absorption line shapes of manganese lipoxygenase at two frequencies: (A) calculations at 9.4 GHZ (X) of intensities for different angular orientations and pairs of energy levels (dots) and (B) line shapes resulting from these transitions; (C) an experimental 94 GHz (W) EPR spectrum of manganese lipoxygenase and (D) the same calculation of line shapes shown in (B) but at the higher EPR frequency 94 GHz. Colors show the pair of energy levels involved in significant transitions (level “1” is lowest in energy): 1 → 2 (red), 1 → 3 (gray), 1 → 4 (orange), 2 → 3 (black), 2 → 4 (green), 3 → 4 (light brown), 3 → 5 (light blue), 4 → 5 (purple) and 5 → 6 (dark green). Calculation parameters included zero field energies D = 0.1 cm–1 and E/D = 0.06. The inset in (C) compares the calculated (lower) and experimental (upper) hyperfine details in the central transition of manganese lipoxygenase. The straight red lines in (C) indicate the same magnetic field range in the inset and the full spectrum. (A) and (B) are adapted with permission from Figure 9 of ref (31) 2009, Springer; and (C) and (D) are adapted with permission from ref (27) 2001, Springer.

