
Figure 3.
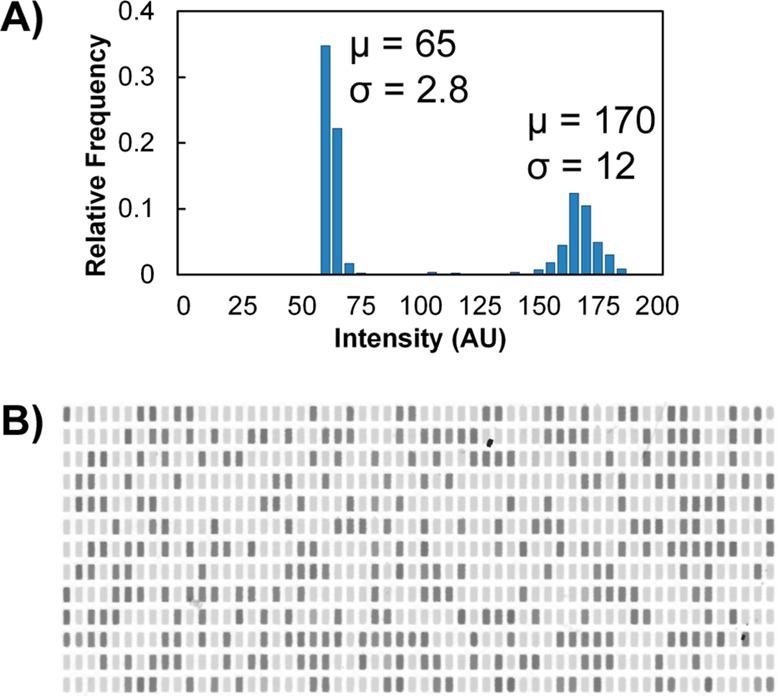
Postamplification well intensity. (A) Typical well intensity distribution for single-cell amplification of TFRC RNA. A high intensity value indicates target amplification. (B) Background-subtracted image of a serpentine array after single-cell digital RT-PCR. Dark volumes indicate target amplification. This image excludes the outermost rows and columns of the array.