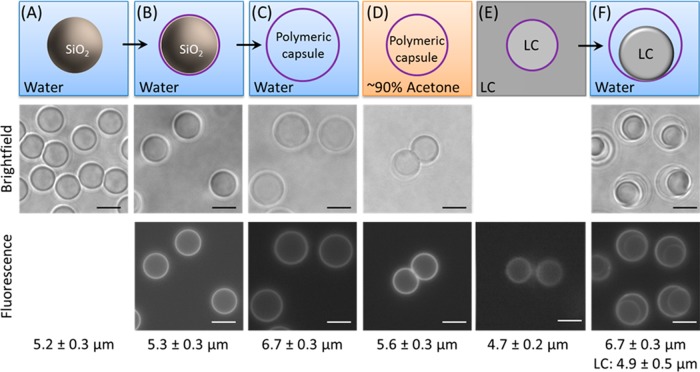
Figure 2.
The top row shows a cartoon of the sample composition, the middle row consists of bright-field images, and the bottom row contains the corresponding fluorescence microscopy images of (A) bare silica microparticles in water, (B) DADM-coated silica microparticles in water, (C) empty DADM capsules in water (after HF treatment and rinsing), (D) empty DADM capsules in a solution of ∼90% acetone and ∼10% water, (E) DADM capsules in nematic E7, and (F) DADM capsules partially filled with E7 in water. The average capsule size is noted below the fluorescence microscopy image, and the LC droplet size is also denoted below (F). Bright-field and fluorescence microscopy images are not shown for all states, e.g., where the sample was not in focus or not fluorescent. Scale bars are 5 μm.

