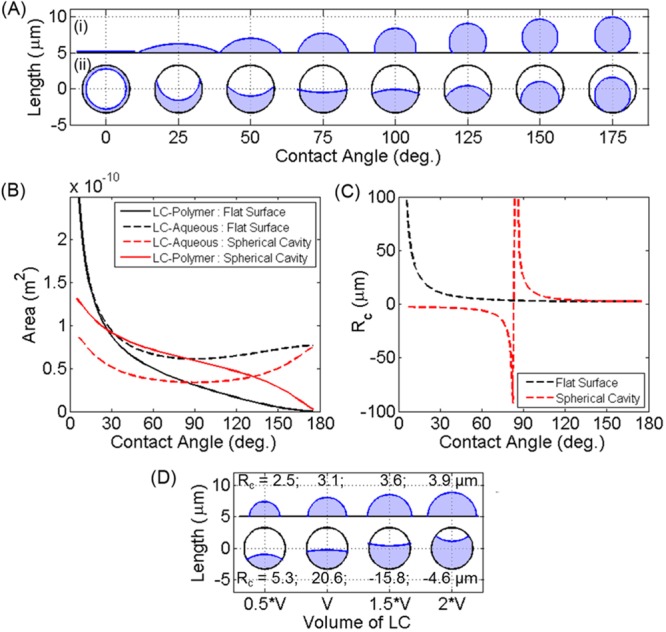
Figure 9.

(A) Calculated shapes for LC droplets of constant volume (using the average experimental volume) with varying contact angle for two geometries: (i) on a flat surface and (ii) within a spherical cavity equal in size to the DADM capsules in water. Black lines represent the flat surface or spherical cavity, and blue lines represent the LC–aqueous interface. Axes are square, with the grid on the x axis marking 10 μm (each droplet is plotted with centers 10 μm apart), and contact angles are used to label the x axis. (B) Graph of interfacial areas; interfaces are indicated within the legend. (C) Graph of the radius of curvature (Rc) of the LC–aqueous interface for each geometry. (D) Shapes plotted for a constant contact angle of 90° for varying volumes of LC, denoted on the plot relative to V, the average volume measured experimentally. The Rc of the LC–aqueous interface is also indicated next to the corresponding droplet.
