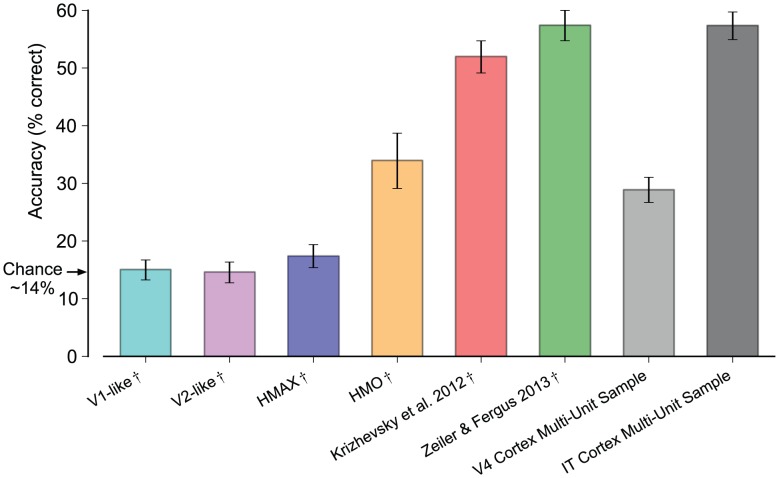
Figure 5. Linear-SVM generalization performance of neural and model representations.
Testing set classification accuracy averaged over 10 randomly-sampled test sets is plotted and error bars indicate standard deviation over the 10 random samples. Chance performance is ∼14.3%. V4 and IT Cortex Multi-Unit Sample are the values measured directly from the neural samples. Following the analysis in Fig. 3A, the model representations have been modified such that they are both subsampled and have noise added that is matched to the observed IT multi-unit noise. We indicate this modification by the  symbol. Both model and neural representations are subsampled to 80 multi-unit samples or 80 features. Mirroring the results using kernel analysis, the IT cortex multi-unit sample achieves high generalization accuracy and is only matched in performance by the Zeiler & Fergus 2013 representation.

