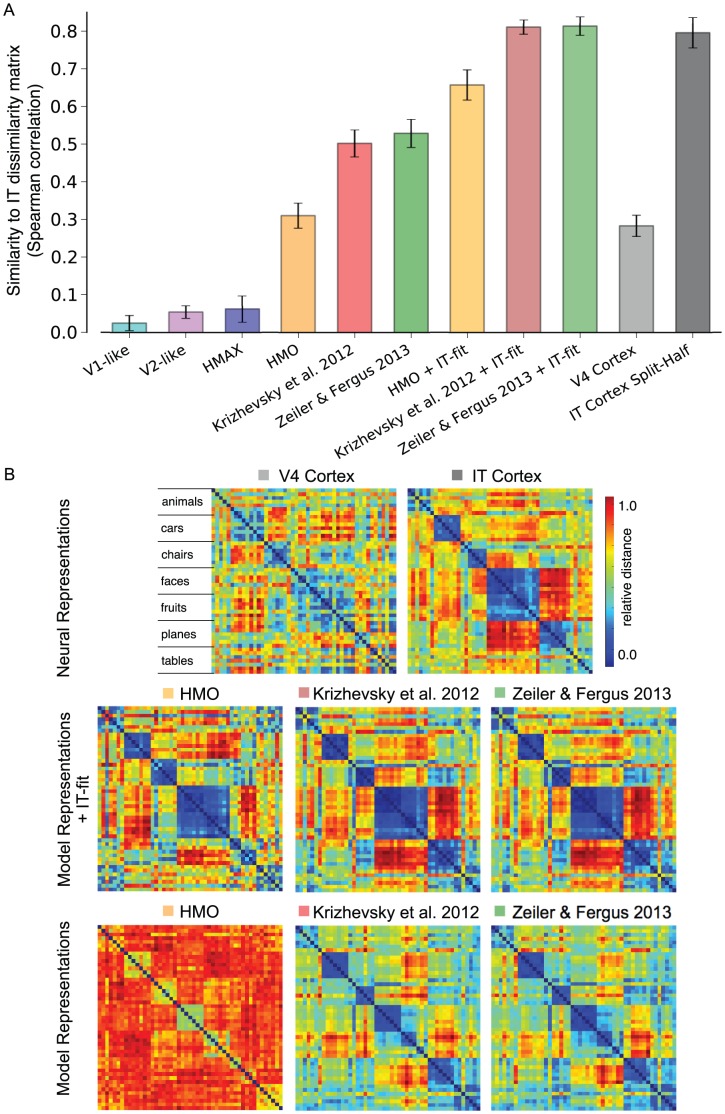
Figure 7. Object-level representational similarity analysis comparing model and neural representations to the IT multi-unit representation.
A) Following the proposed analysis in [32], the object-level dissimilarity matrix for the IT multi-unit representation is compared to the matrices computed from the model representations and from the V4 multi-unit representation. Each bar indicates the similarity between the corresponding representation and the IT multi-unit representation as measured by the Spearman correlation between dissimilarity matrices. Error bars indicate standard deviation over 10 splits. The IT Cortex Split-Half bar indicates the deviation measured by comparing half of the multi-unit sites to the other half, measured over 50 repetitions. The V1-like, V2-like, and HMAX representations are highly dissimilar to IT cortex. The HMO representation produces comparable deviations from IT as the V4 multi-unit representation while the Krizhevsky et al. 2012 and Zeiler & Fergus 2013 representations fall in-between the V4 representation and the IT cortex split-half measurement. The representations with an appended “+ IT-fit” follow the methodology in [27], which first predicts IT multi-unit responses from the model representation and then uses these predictions to form a new representation (see text). B) Depictions of the object-level RDMs for select representations. Each matrix is ordered by object category (animals, cars, chairs, etc.) and scaled independently (see color bar). For the “+ IT-fit” representations, the feature for each image was averaged across testing set predictions before computing the RDM (see Methods).

