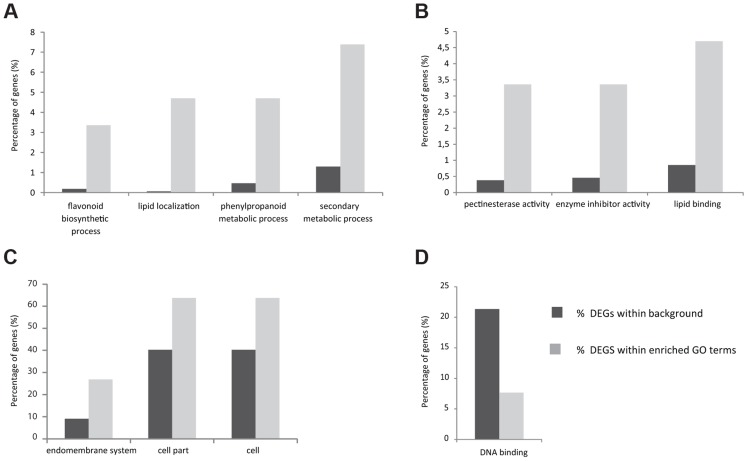
Figure 1. Histogram of functional gene ontology analysis of differentially expressed genes.
Slim Plant term enrichment - up and down-regulated genes. Genes with higher expression in stk in the Biological Process (A), Molecular Function (B) and Cellular Component (C) categories. Genes with lower expression in stk Molecular Function category (D).

