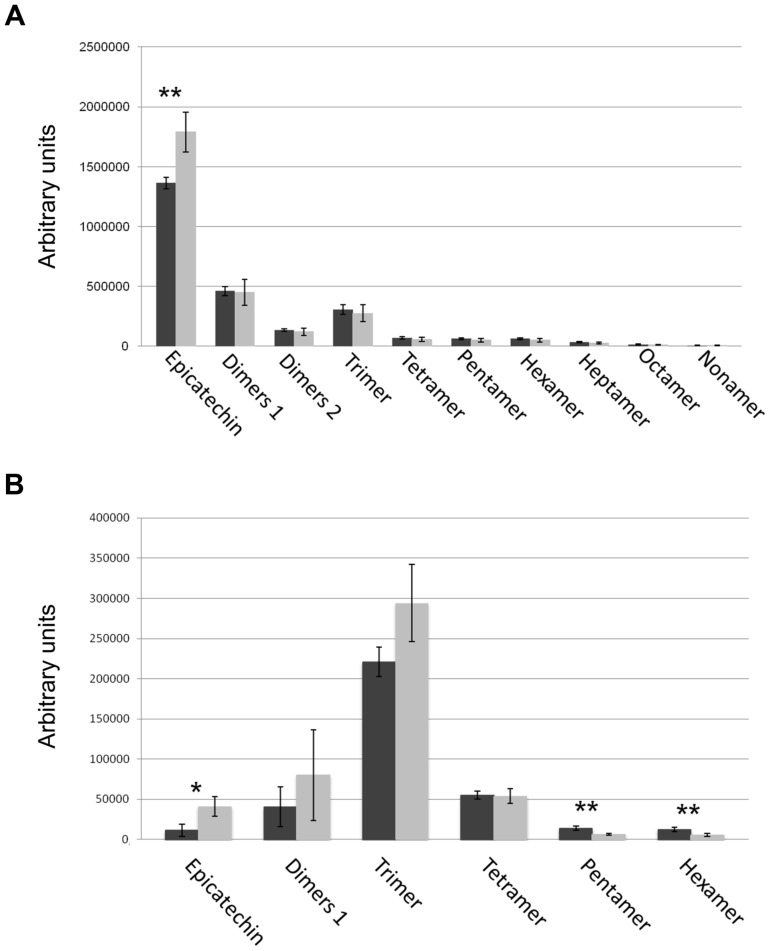
Figure 3. Solvent soluble PAs analysed by LC-MS.
Soluble PAs were detected in wild type (black bars) and the stk mutant (grey bars) at the immature (6 DAP; A) and mature (B) stages of seed development. Error bars represent SD of three independent measurements. Asterisks indicate statistically significant differences as determined by Student's t test (* P<0.05, ** P<0.01).

