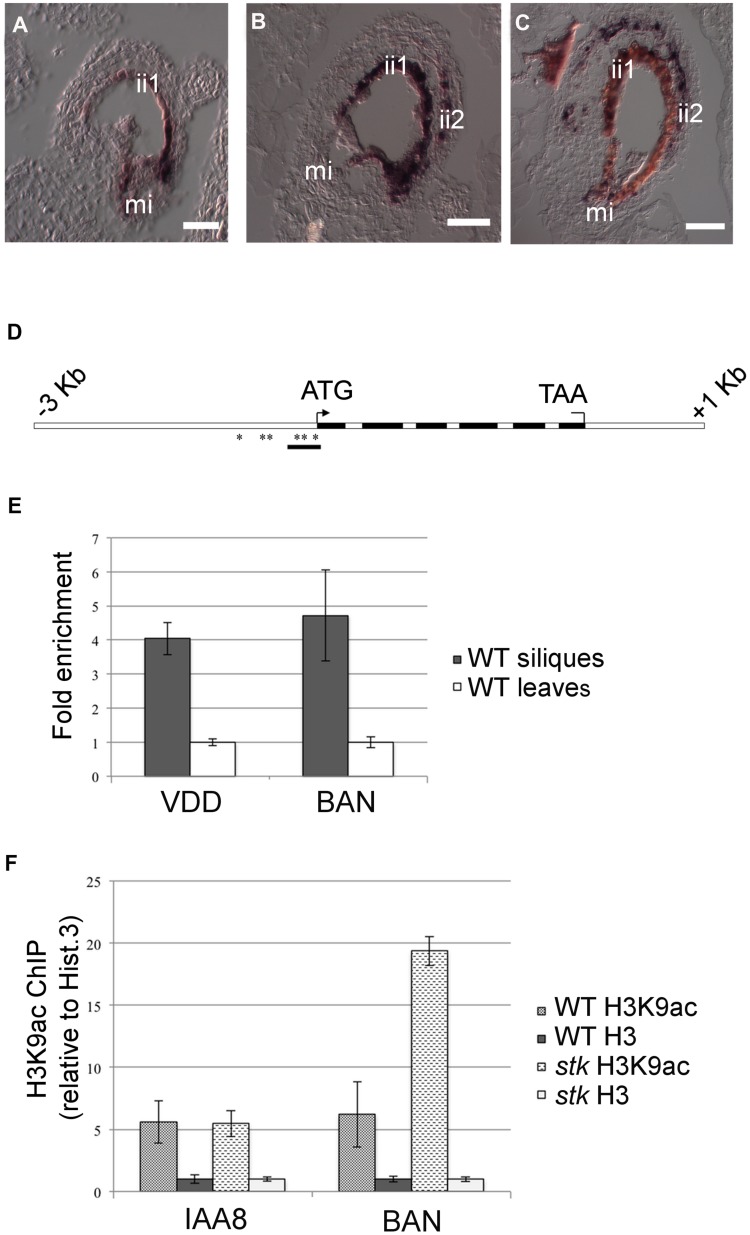
Figure 5. STK directly regulates BAN expression through the modification of chromatin state.
(A) In situ hybridization experiments illustrating the expression of the BAN transcript: in wild-type seeds at 1 DAP, BAN is expressed only in the endothelium layer. (B) BAN expression in the stk mutant background at 1 DAP and (C) at 4 DAP. In the stk mutant background, BAN expression is affected: the BAN transcript was detected not only in the endothelium layer but also in the ii2 layer. (D) Schematic representation of CArG box positions indicating the regions analysed by the ChIP experiment (black bars). Black boxes: exons; white boxes: promoter, introns, 3′ and 5′ UTRs. Asterisks indicate CArG boxes. (E) ChIP enrichment tests by qRT-PCR show that STK binds to the selected region of BAN. Fold enrichment was calculated over the negative controls. Error bars represent the propagated error value using three replicates. (F) ChIP enrichment tests by qRT-PCR show that STK negatively correlates with the H3K9ac acetylation mark at the BAN translational start site. qRT-PCR quantification of BAN sequences in precipitated chromatin was used to infer the acetylated histone H3 and total histone H3 representation at the STK-binding site. Levels of histone modification were normalized to total histone H3. Ct values were used to calculate the IP/IN signal. ChIP enrichments are presented as the percentage (%) of bound/input signal. ChIP enrichments for H3K9ac were normalized to histone H3 density. We tested the efficiency of IP by quantifying the presence of the H3K9ac mark in IAA8 [49] which was shown to be strongly and equally expressed in both samples and yielded equal enrichment ratios. mi, micropyle; ii1, endothelium; ii2, internal layer of inner integument. Scale bars = 40 µm (A–C).

