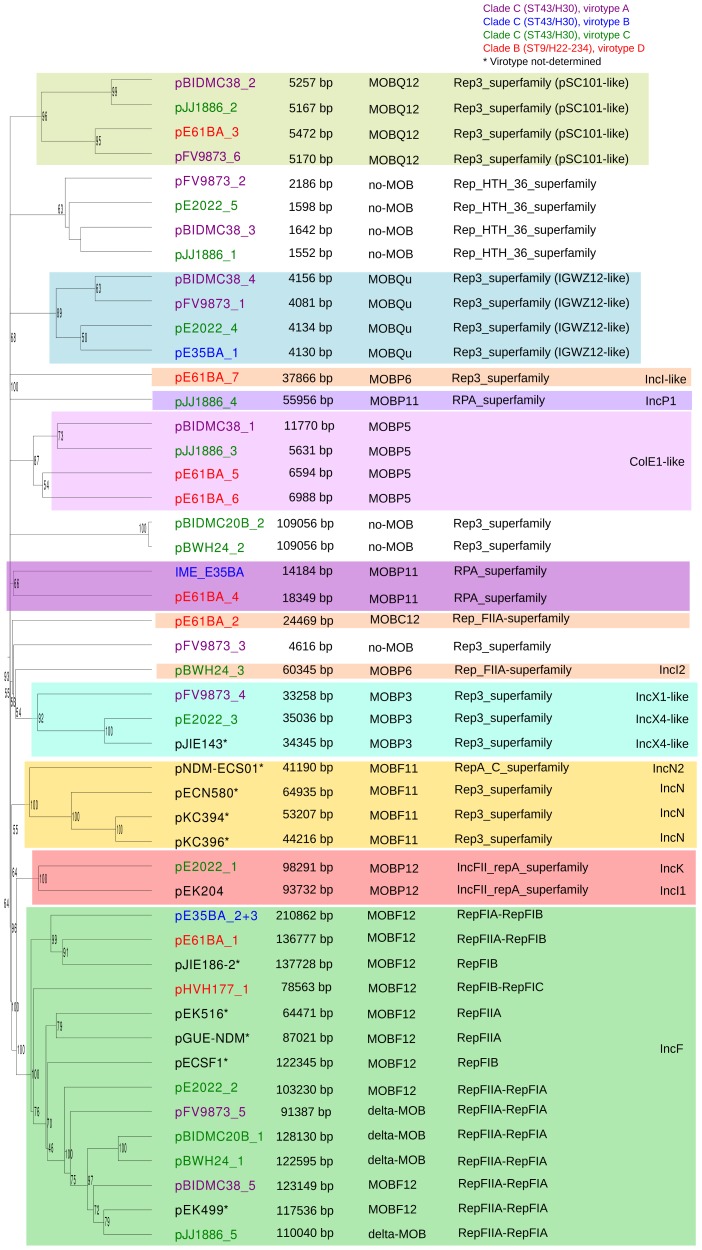
Figure 3. Hierarchical clustering dendrogram of ST131 plasmids.
The UPGMA dendrogram was based on protein cluster analysis using 60% sequence identity and 80% coverage. Plasmid names are colored according to their clade, taking into account ST, fimH allele and virotype, following the color code shown at the upper right. The five plasmid names in black correspond to previously sequenced plasmids from ST131 strains. Different color backgrounds are shown to emphasize branches of related plasmids. To the right of the dendrogram, four columns show, respectively, plasmid size, MOB type, RIP type and Inc type.

