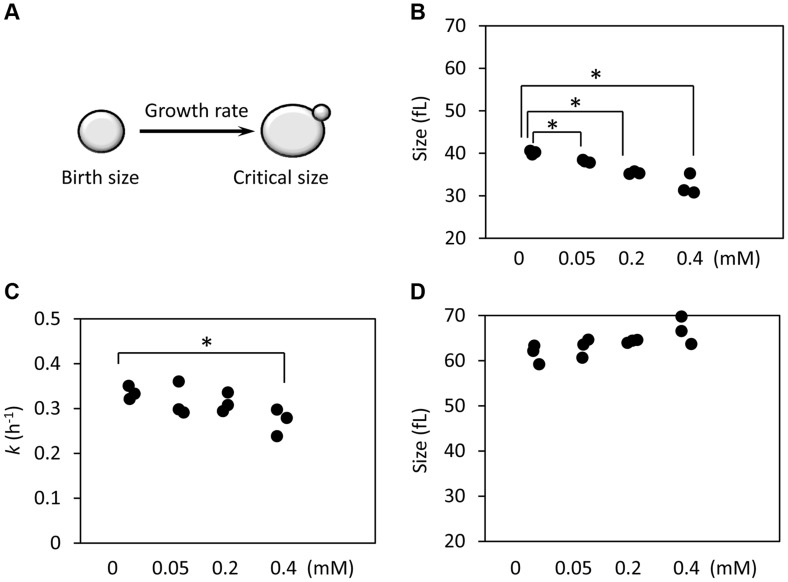
Figure 5. Ibuprofen at low doses moderately delays G1, primarily through a reduction in birth size.
A, Schematic of the variables that determine the length of the G1 phase. B, The birth size of BY4743 cells exposed at different doses of ibuprofen was measured from three independent experiments in each case, similar to the ones shown in S4 Figure. Asterisks indicate statistically significant differences compared to the untreated samples (p<0.05, from Student's t tests). C, The specific rate of cell size increase constant k (in h−1) was measured from the elutriation experiments shown in S5 Figure, assuming exponential growth. D, The critical cell size of the indicated strains (shown in fl), was measured from the same elutriation experiments shown in C and S5 Figure.

