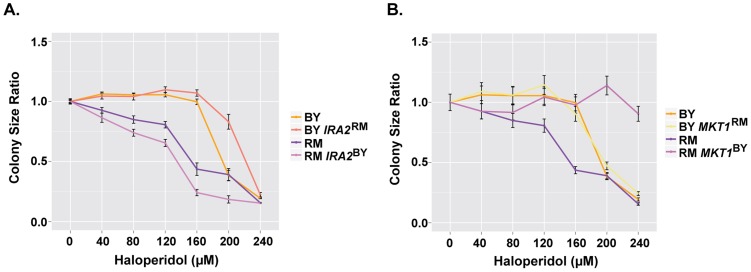
Figure 5. IRA2 and MKT1 underlie resistance to haloperidol at high concentrations.
(A) Comparison of colony radius ratio between BY and RM with swapped IRA2 alleles. (B) Comparison of colony radius ratio between BY and RM with swapped MKT1 alleles. Saturated cultures were spotted onto YPD agar plates supplemented with 0–240 µM haloperidol, plated were incubated at 30°C for ∼48 hr. Mean colony size ratio ±1 s.d. are plotted.

