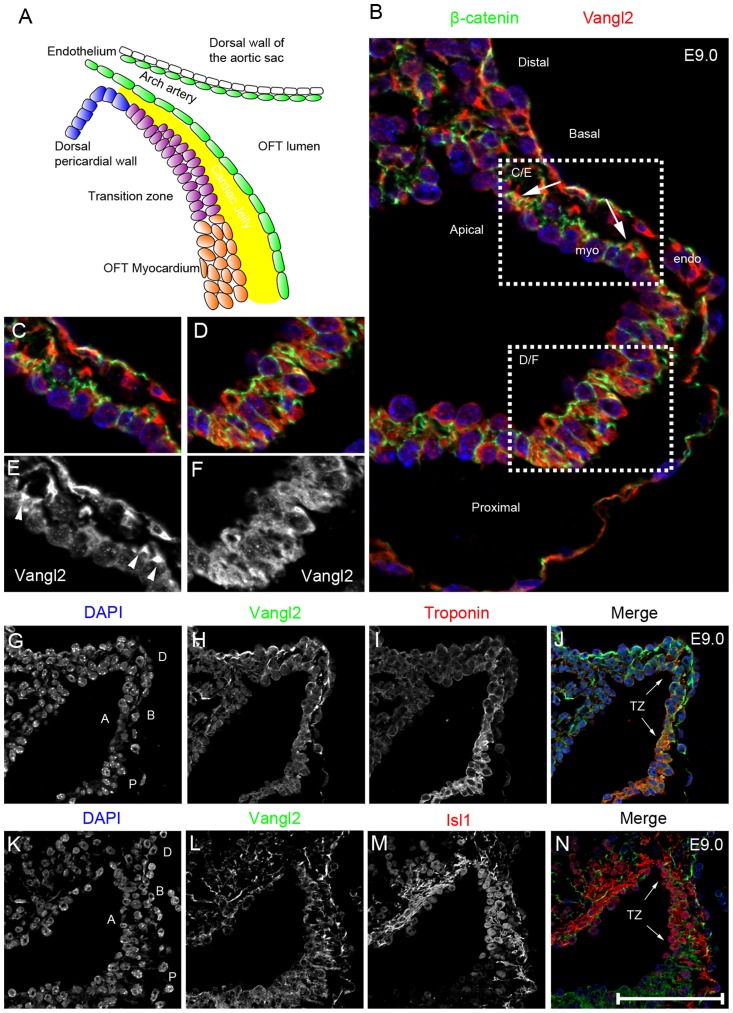
Figure 5. Vangl2 is expressed in the distal outflow region.
A) Cartoon showing the region encompassing the dorsal pericardial wall and the distal outflow tract, including the region we describe as the transition zone. B–F) Vangl2 protein (red), labelled by immunofluorescence, is expressed in the distal outflow region (B), localising to the basal part of the membrane of the cells (as shown by co-localisation with β-catenin, a baso-lateral marker; green) in the dorsal pericardial wall and transition zone (B,C,E), but is found diffusely in the cytoplasm more proximally (B,D,F). G–H) Cardiac troponin I staining (red; labelling cardiomyocytes) is initially weak within the distal outflow but is upregulated more proximally (I). Vangl2 (green) and cardiac troponin I are co-expressed in the transition zone (J - TZ and arrows) of the outflow tract with the membrane-localisation of Vangl2 gradually lost (H) as cardiac troponin I staining becomes stronger. K–N) Vangl2 and Isl1 are also co-expressed in the cells of the transition zone (N - TZ and arrows), with the loss of Vangl2 from the membrane proximally coinciding with the loss of nuclear Isl1 localisation (N - lower white arrowhead). All images shown are of Vangl2f/+ embryos. A = Apical, B = Basal, D = distal, endo = endocardium, myo = myocardium, P = proximal, TZ = transition zone. Scale bar = 25 µm.

