
Figure 4. Time sequence of changes in percentage time per hour of prolonged slow wave interictal activity and levels of oxidised CytOx (μmol 100 g−1) for the first 24 h after umbilical cord occlusion in asphyxia–saline and asphyxia–dexamethasone groups.
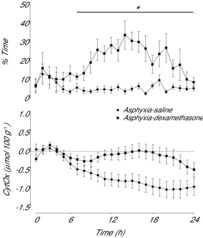
Data are 1 h means ± SEM. *Asphyxia–saline vs. asphyxia–dexamethasone, P < 0.05. CytOx, cytochrome oxidase.