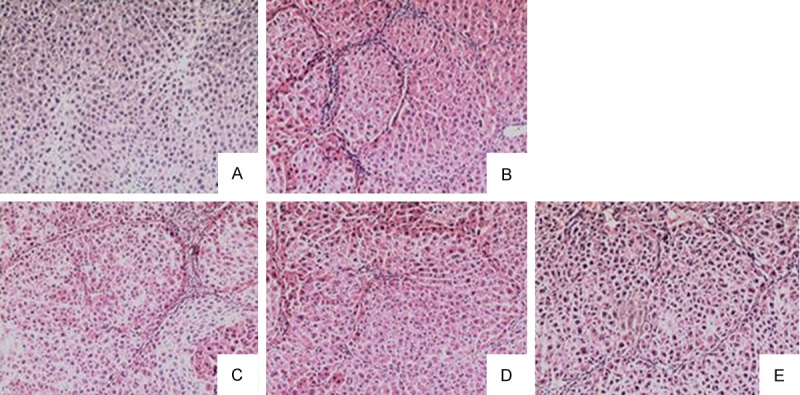
Figure 2.

Histological assessment of liver sections by H&E staining (×100). A. Liver sections from the control group; B. Liver sections from the model group; C. Liver sections from the 100 mg/kg ZTO group; D. Liver sections from the 200 mg/kg ZTO group; E. Liver sections from the 400 mg/kg ZTO group.
