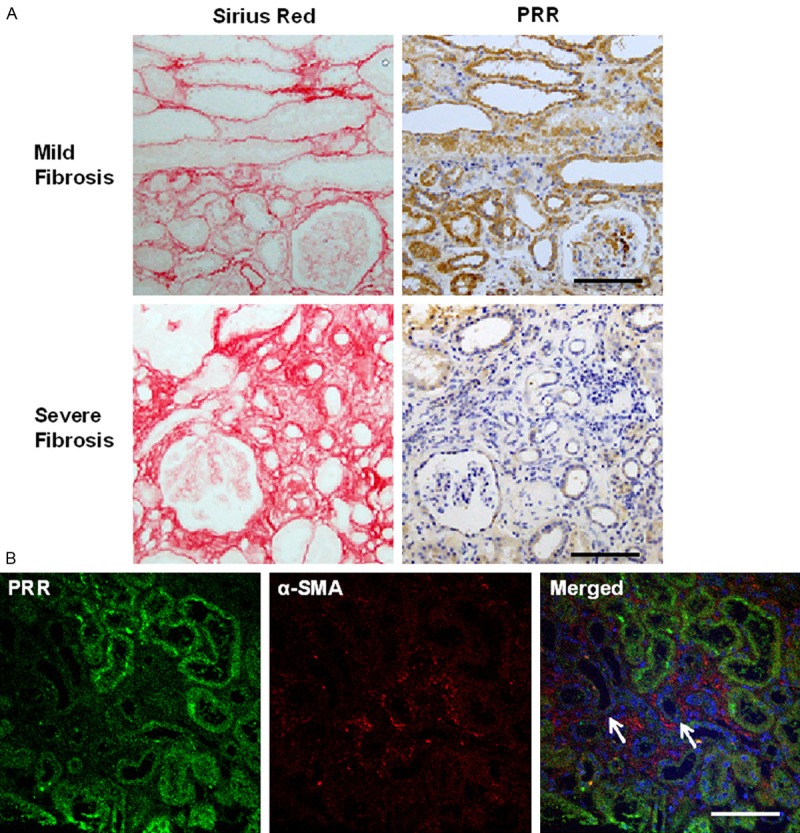
Figure 3.

Local relationship between PRR expression and interstitial fibrosis. A. The left and right panels show, respectively, Sirius red-stained and PRR-immunostained serial sections. The upper and lower panels respectively show specimens with mild and severe fibrosis. Bars, 100 μm; B. Confocal micrographs showing double immunostaining for PRR (green) and α-smooth muscle actin (red); note the inverse relation between the signal intensities. The PRR signal tended to be weak in the tubules (arrows) bordering the interstitium where the α-smooth muscle actin signal from myofibroblasts was strong. Bar, 100 μm.
