
Figure 2.
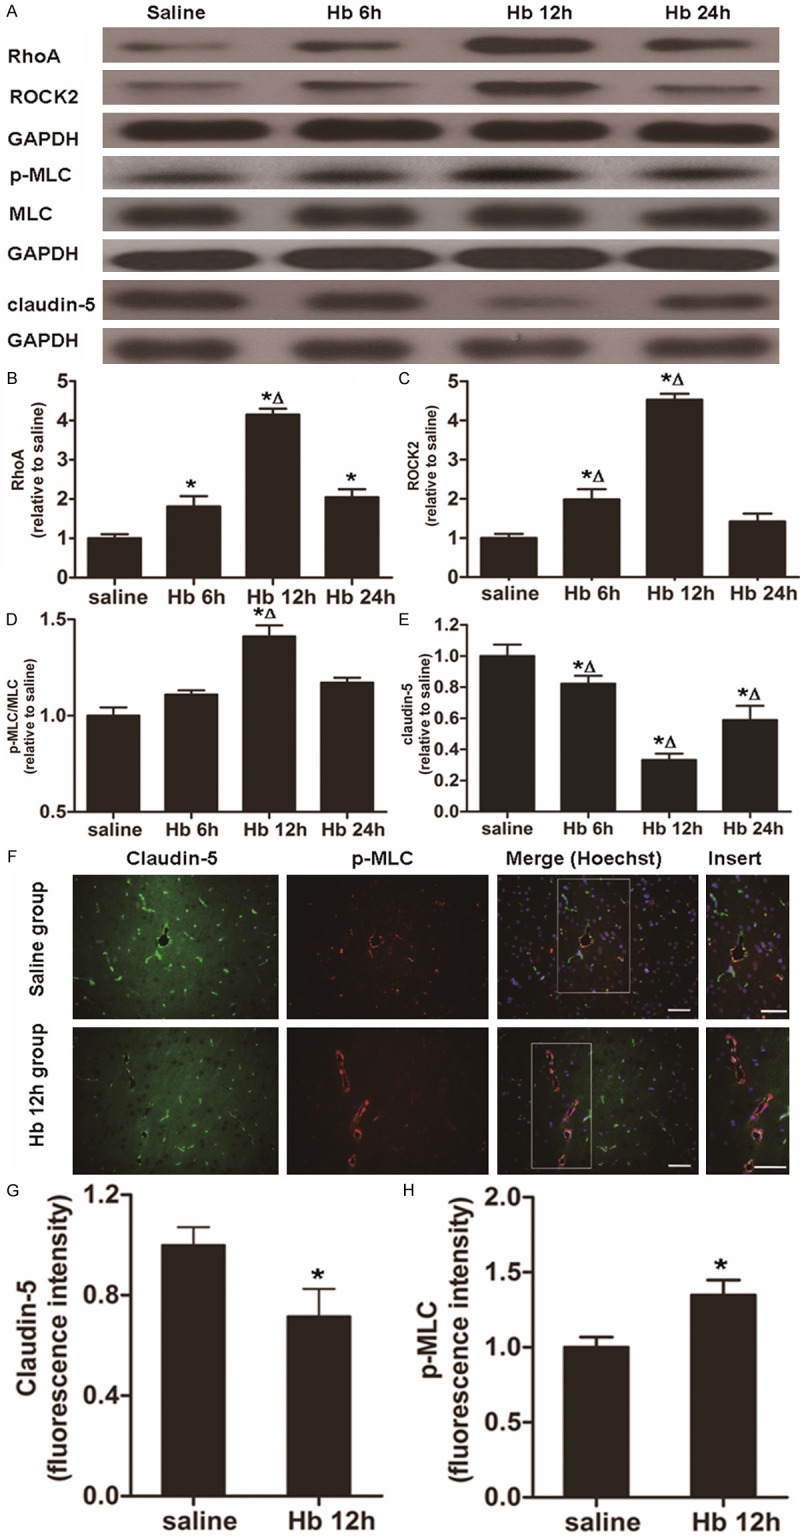
Alterations in protein expression of RhoA, ROCK2 and claudin-5 as well as changes in ROCK activity (p-MLC/MLC). (A) Western blotting analysis of protein expression of RhoA, ROCK2, p-MLC, MLC and claudin-5 at 6, 12 and 24 h after Hb injection. (B-E) Quantification of relative protein expression of (B) RhoA, (C) ROCK2, (D) p-MLC/MLC and (E) claudin-5 at 6, 12 and 24 h after Hb injection. (F) Immunohistochemical analysis of the expression of claudin-5 and p-MLC in Hb group at 12 h. Green, claudin-5; red, p-MLC. Merge means the combination of claudin-5 and p-MLC. Nuclei were stained using Hoechst. Scale bar = 100 μm. (G, H) Quantification of fluorescence intensity of (G) claudin-5 and (H) p-MLC. Data are means ± SD. *, P < 0.05 compared with normal control group; Δ, P < 0.05 compared with Hb group at other time points.