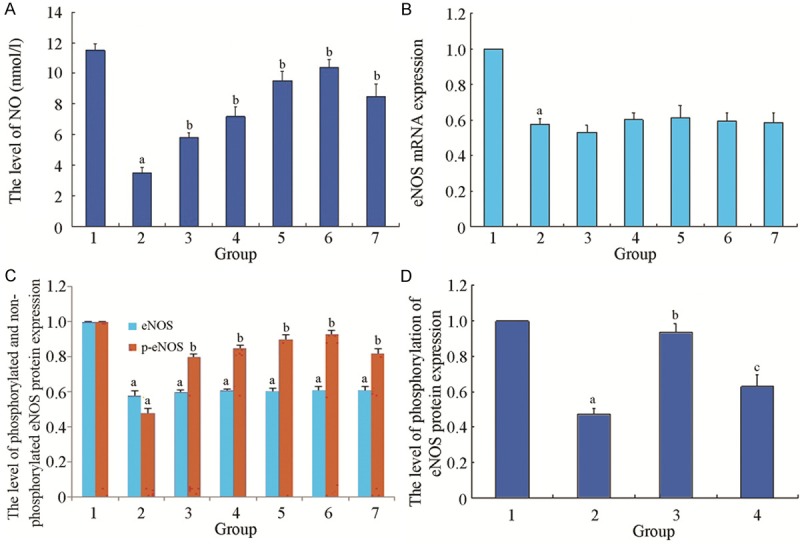
Figure 1.

A. The effect of rhACE2 on the NO content of HUVEC cultured supernatant. 1: normal control group; 2: Ang II intervention group; 3: rhACE2 5 min group; 4: rhACE2 10 min group; 5: rhACE2 15 min group; 6: rhACE2 30 min group; 7: rhACE2 60 min group. Compared with normal control group, a P < 0.05; Compared with Ang II intervention group, b P < 0.05; n=6 in each group. B. The effect of rhACE2 on the relative expression of eNOS mRNA of each group. 1: normal control group; 2: Ang II intervention group; 3: rhACE2 5 min group; 4: rhACE2 10 min group; 5: rhACE2 15 min group; 6: rhACE2 30 min group; 7: rhACE2 60 min group. Compared with normal control group, a P < 0.05; n=6 in each group. C. The effect of rhACE2 on the relative expression of non-phosphorylated and phosphorylated eNOS protein of each group. 1: normal control group; 2: Ang II intervention group; 3: rhACE2 5 min group; 4: rhACE2 10 min group; 5: rhACE2 15 min group; 6: rhACE2 30 min group; 7: rhACE2 60 min group. Compared with normal control group, a P < 0.05; Compared with Ang II intervention group, b P < 0.05; n=6 in each group. D. The effect of inhibitor P13K/AKT on the relative expression of phosphorylated eNOS protein of each group. 1: normal control group; 2: Ang II intervention group; 3: rhACE2 15 min group; 4: LY294002 group. Compared with normal control group, a P < 0.05; Compared with Ang II intervention group, b P < 0.05; n=6 in each group; Compared with rhACE2 intervention group, c P < 0.05.
