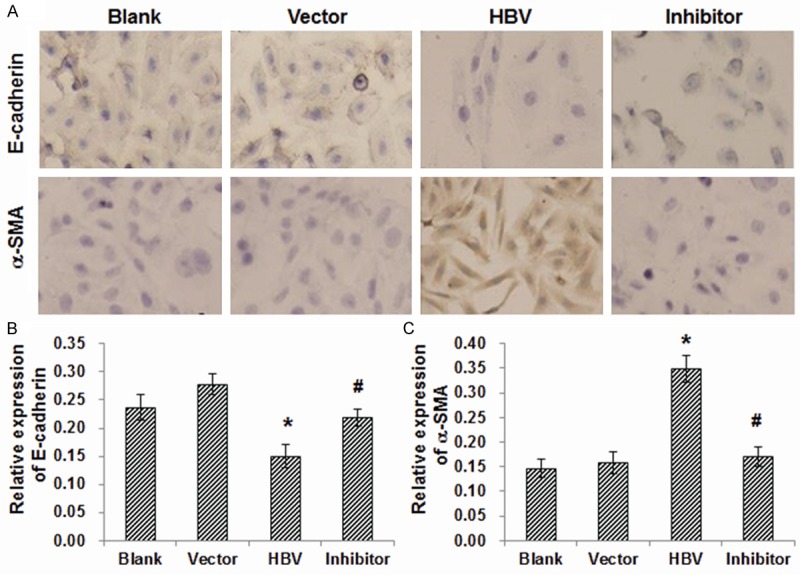
Figure 1.

Immunocytochemical staining of E-cadherin and a-SMA in HK-2 cells. (A) HK-2 cells were subjected to immunocytochemical staining to detect the expression of E-cadherin (upper panel) and a-SMA (lower panel) (×200). The blank control group was free from intervention; the vector control group was transfected with empty plasmid (PHY106); the HBV-transfected group was transfected with PHY106-CHBV DNA; and the inhibitor-treated group was pre-treated with SB203580, and then transfected with PHY106-CHBV DNA. (B, C) Statistical analysis of the optical densities in the immunocytochemical staining of E-cadherin (B) and a-SMA (C). Compared with the blank and vector control groups, *P < 0.05; compared with the HBV-transfected group, #P < 0.05.
