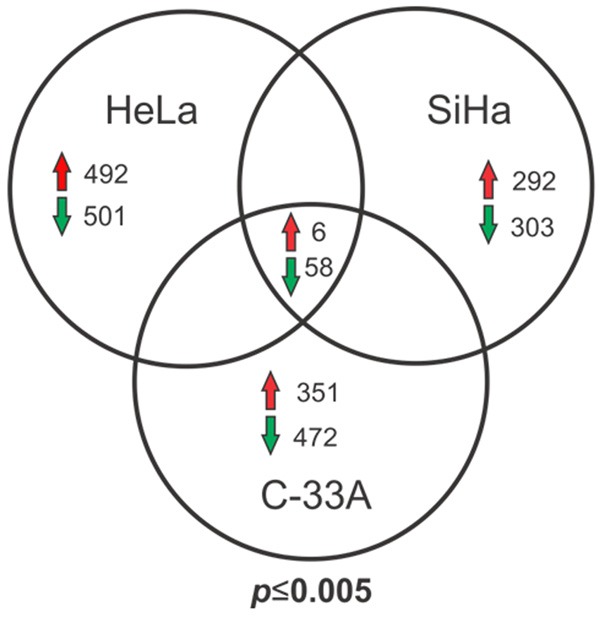
Figure 1.

Venn diagram of differentially expressed genes in CCCLs versus HaCaT cells determined using microarray analysis. Comparison of genes differentially expressed between CCCLs (HeLa, SiHa, and C-33A) with respect to the keratinocyte-derived non-tumorigenic cell line HaCaT. Common up- or down-regulated genes in the three tumorigenic cell lines vs. HaCaT are shown. Statistically significant (P ≤ 0.005).
