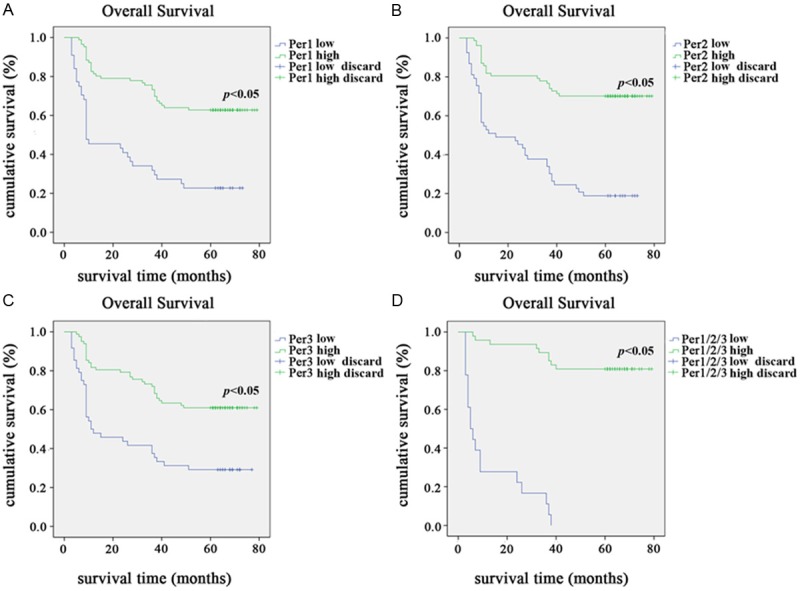
Figure 3.

Kaplan-Meier survival curves for NSCLC patients with Per1, Per2 and Per3 negative expression (blue line) versus Per1, Per2 and Per3 positive expression (green line). A. The overall survival of patients (clinical stages I-III) with low/high Per1 expression; B. The overall survival of patients (clinical stages I-III) with low/high Per2 expression; C. The overall survival of patients (clinical stages I-III) with low/high Per3 expression; D. The patients with Per1/Per2/Per3 triple high expression revealed a significant difference in overall survival when compared with those patients with Per1/Per2/Per3 triple low expression.
