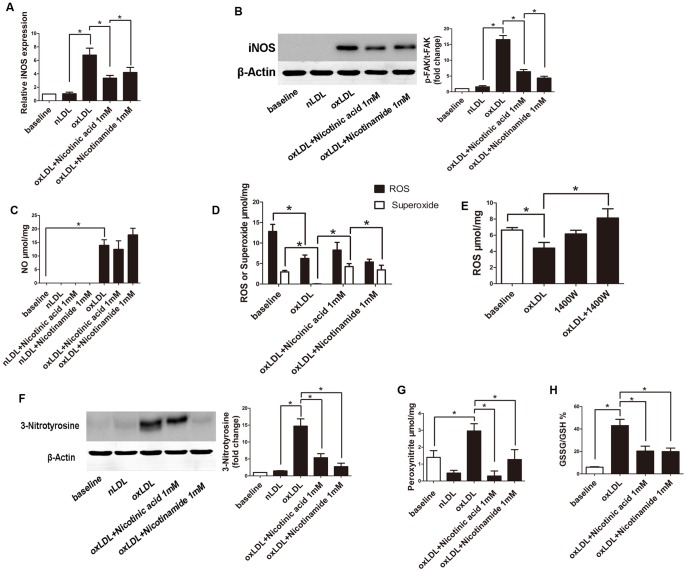
Figure 3. Measurement of iNOS, p-FAK, 3-Nitrotyrosine expression, production of NO, ROS, superoxide, peroxynitrite and GSSG/GSH in RAW264.7 cells.
A. iNOS expression of RAW264.7 cells of each group was tested by “real time” PCR using comparative CT method. (*, P<0.05, n = 3). B. Representative western blot of iNOS expression of RAW264.7 cells of each group. (*, P<0.05, n = 3). C. The intracellular NO production was measured by ESR. (*, P<0.05, n = 5). D. Intracellular ROS and superoxide was measured by ESR. (*, P<0.05, n = 5). E. Intracellular ROS was measured by ESR. (*, P<0.05, n = 5). F. Representative western blot of 3-Nitrotyrosine. Band intensities were quantified by ImageJ and normalized to β-actin. (*, P<0.05, n = 3). G. Extracellular peroxynitrite was measured by ESR. (*, P<0.05, n = 6). H. GSSG/GSH of RAW264.7 cells measured by HPLC.(*, P<0.05, n = 4).

