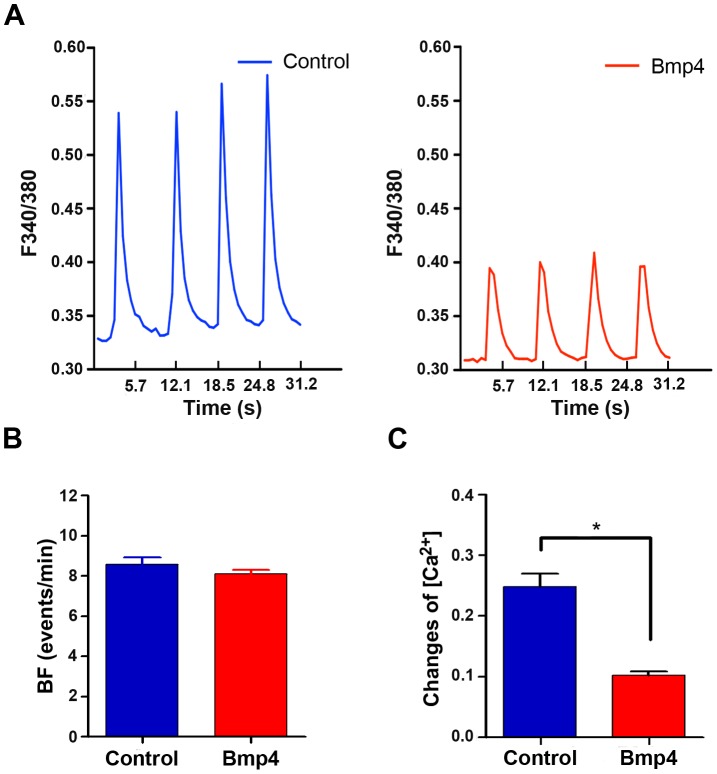
Figure 3. Calcium transients of cardiomyocytes derived from Isl1-CPC after cell loading with Ca2+ indicator fura-2.
(A) Representative recordings for increase in [Ca2+]i transient amplitude and frequency was measured following loading of control and Bmp4-treated cardiomyocyte cultures with Ca2+ indicator fura-2. Cytosolic Ca2+ of spontaneous beating cardiomyocyte was measured by ratio of fluorescence intensity at 340 nm and 380 nm (F340/F380). The measurements were recorded 6 days of incubation after Isl1-CPC isolation. (B) The quantitative representation of beating frequency (BF) of calcium transients per minute is shown by bar graphs (n = 3). Experiments were repeated 3 times and 10–15 cells were measured in each experiment. (C) Change of [Ca2+] was calculated from Ca2+ transient recordings for cardiomyocyte cultures differentiated in the absence or presence of Bmp4. *p<0.05; n = 3 independent experiments.

