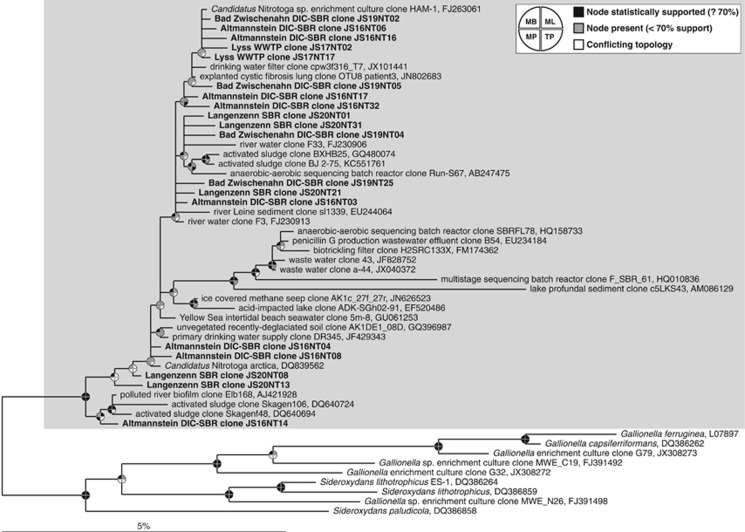
Figure 1.
Phylogenetic analysis of the candidate genus Nitrotoga (gray box) and selected members of the family Gallionellaceae. Displayed is a Bayesian interference tree (s.d.=0.009882) including representative nearly full-length 16S rRNA gene sequences related to N. arctica strain 6680. Pie charts indicate statistical support of nodes based on bootstrap analysis or Bayesian inference. Bootstrap values are based on 100 iterations. Sequences obtained in this study are printed in bold. The scale bar corresponds to 5% estimated sequence divergence. MB, Bayesian inference; ML, maximum likelihood; MP, maximum parsimony; TP, Treepuzzle.

