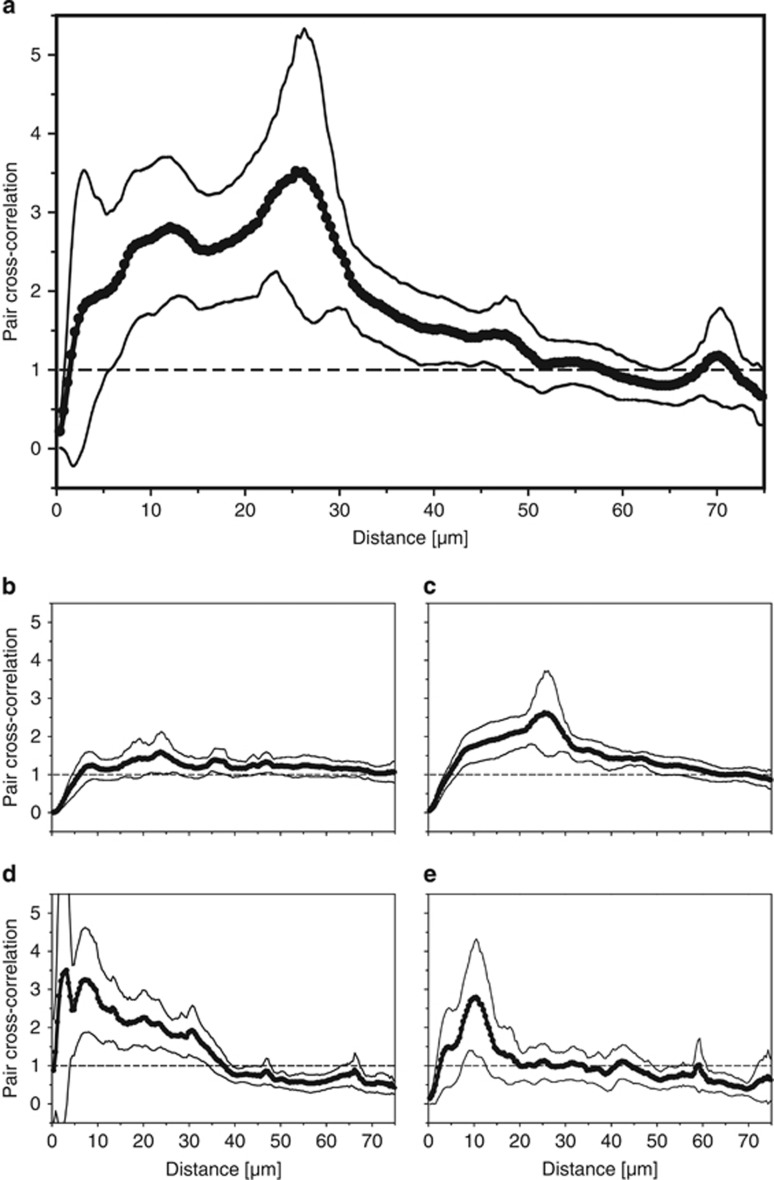
Figure 3.
Statistical analyses of the spatial arrangement patterns of NOB and AOB in the activated sludge samples from the Bad Zwischenahn (a–c) and Deuz (d, e) WWTPs. (a–c) Spatial arrangement of Nitrotoga-like bacteria relative to (a) AOB, (b) all other Betaproteobacteria excluding AOB and (c) all other Betaproteobacteria including AOB. (d and e) Spatial arrangement of (d) Nitrospira-like and (e) Nitrotoga-like bacteria relative to AOB. Black circles depict the mean pair cross-correlation function, and the upper and lower lines delimit 95% confidence intervals. Values >1 indicate coaggregation, values <1 repulsion and values =1 (dashed horizontal line) random distribution at the corresponding distance (Daims et al., 2006).

