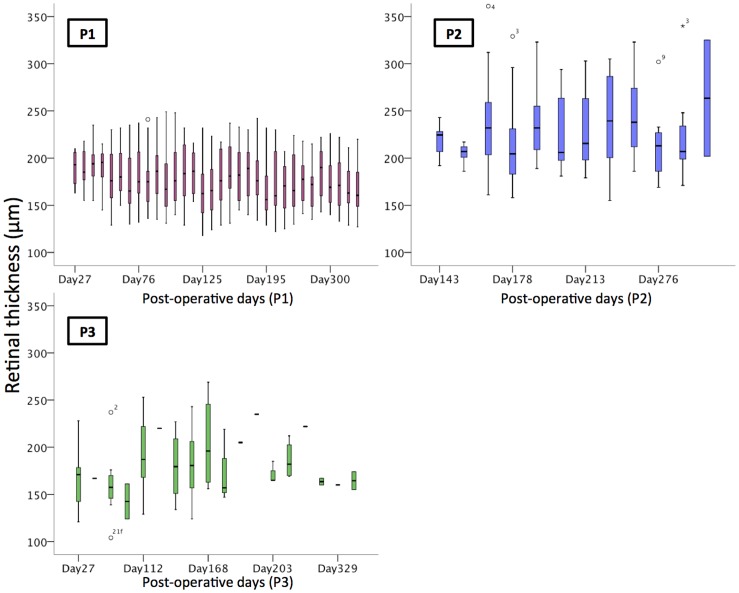
Figure 5. Retinal thickness measurements over time, showing no observable change in the maximum retinal thickness above the electrode array in the initial twelve months in all three patients.
Each boxplot includes the maximum (upper whisker, excluding outliers), upper quartile (top of box), median (horizontal line in box), lower quartile (bottom of box) and minimum values (lower whisker). Open circles are outliers. The numbers represent the electrode location (see Fig. 2), and the horizontal lines on the graph of P3 represent single data points.

