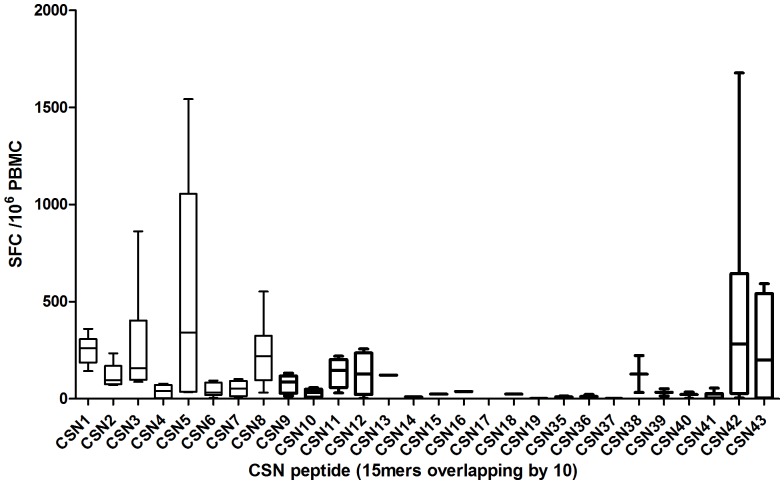
Figure 6. Median & Interquartile range ELISpot responses in SFC/106 PBMC at day 63 by peptide.
Box plots of the medians and 25% and 75% percentiles of response to each peptide. The first and third quartiles are the top and base of each box, the upper and lower bars represent the maximum and minimum values respectively.

