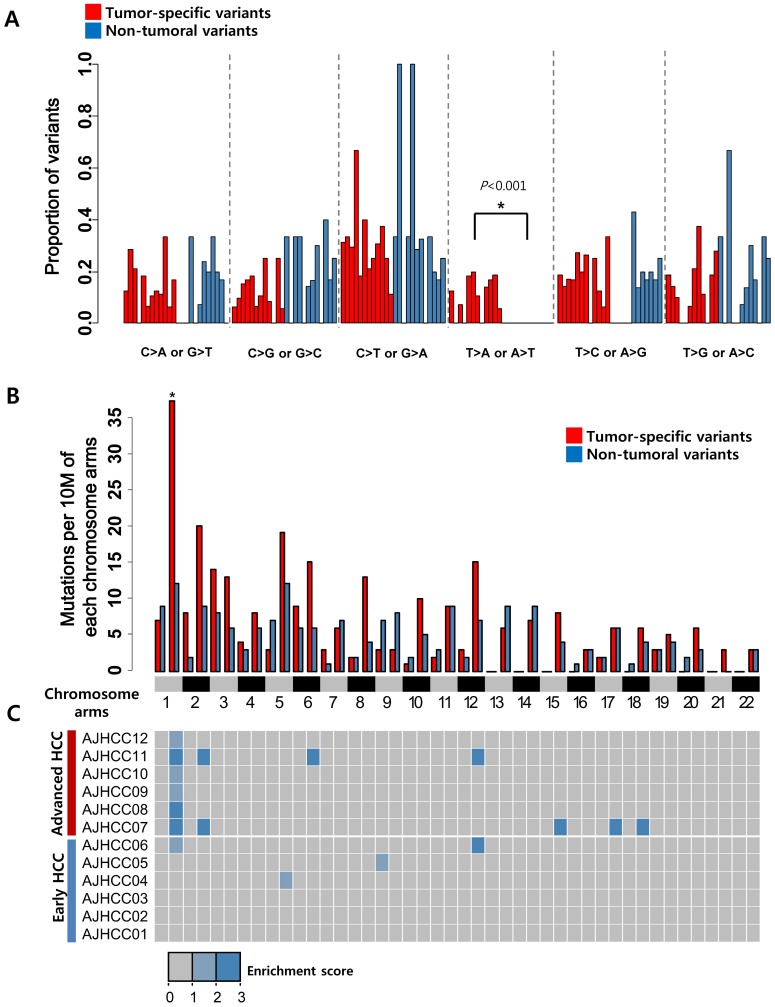
Figure 2. The mutation spectra of tumor-specific variants.
A. Mutation spectrum of tumor-specific and non-tumor-specific variants are shown. B. The observed numbers of mutations per 10 million bases in each chromosome arm are plotted for tumor-specific and non-tumoral variants, respectively. Statistical analysis compared the occurrence of tumor-specific variants with that of non-tumoral variants. (*P<0.01, **P<0.001). C. Heatmap indicates the enrichment scores of tumor-specific variants which calculated as the odds ratios of the numbers of variants in each chromosome arm against those of outside the chromosome arm in each patient. The enrichment score less than 1 was truncated to zero.

