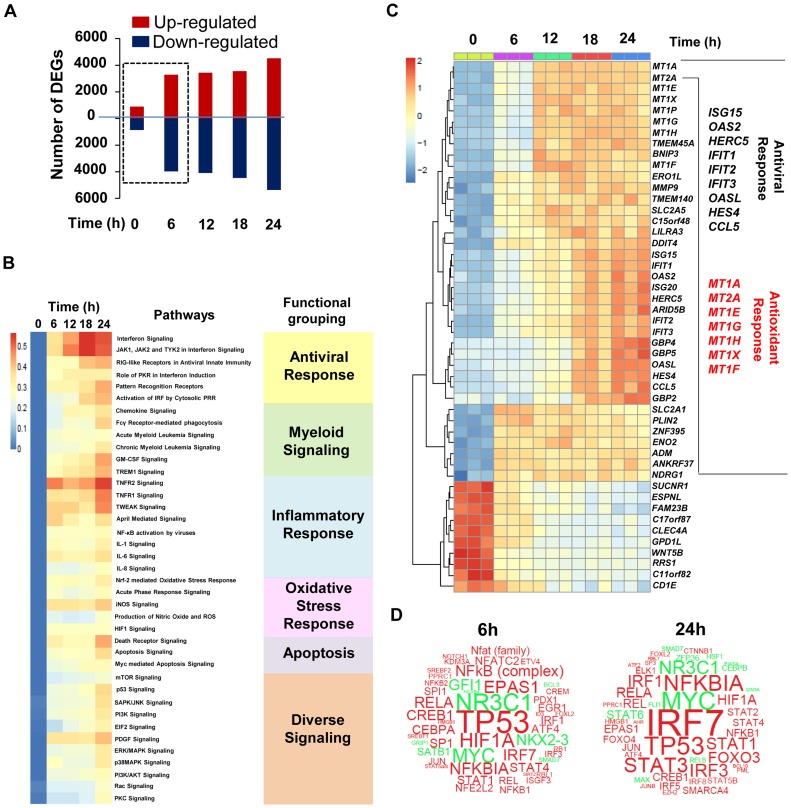
Figure 2. Transcriptome analysis of the host response to DENV2 infection in Mo-DC.
Mo-DC were infected with DENV2 (MOI 20) for designated periods of time. Samples were analyzed by Illumina gene expression array and differentially expressed genes (DEGs) that satisfied a p value (<0.05) with ≥1.3 fold change (up or down) were selected. (A) Waterfall plot representing the total number of up-regulated and down-regulated genes at each time point. (B) Heat map shows statistically significant canonical pathways (Ingenuity Pathway Analysis Software) commonly regulated at 6 h, 12 h, 18 h and 24 h when compared to baseline. Genes that had adjusted p-value <0.05 at each time point and fold change >1.3 or <−1.3 and associated with a canonical pathway in Ingenuity's Knowledge Base were used for pathway analysis. Heat map colors represent the ratio of regulated genes/pathway genes after dengue infection (red and blue correspond to over- and under-represented, respectively). The over-representation test was performed using Fisher Exact Test. Statistical significance achieved at p<0.05. The data are representative of one experiment performed on three different donors. (C) Gene expression heatmap of the top 50 differentially expressed genes induced by dengue infection in Mo-DC at various times when compared to baseline. Genes are selected as differentially expressed in at least one comparison following ANOVA F test as implemented in the LIMMA package. The scale shows the level of gene expression where red and blue correspond to up- and down-regulation respectively. A panel of antiviral (black) and antioxidant (red) DEG is represented on the right hand side of the heatmap. (D) Word clouds representing potentially activated (red)/inhibited (green) transcription factors at 6 h and 24 h after DENV2 challenge. IPA Upstream Regulator Analysis was used to identify molecules upstream of the genes in the data set that could explain the detected expression changes. The p-value of overlap, which measures the enrichment of network-regulated genes in the data set, is represented by the size of the word. The activation z-score which predicts likely regulating molecules was used to color the predicted activation state.

