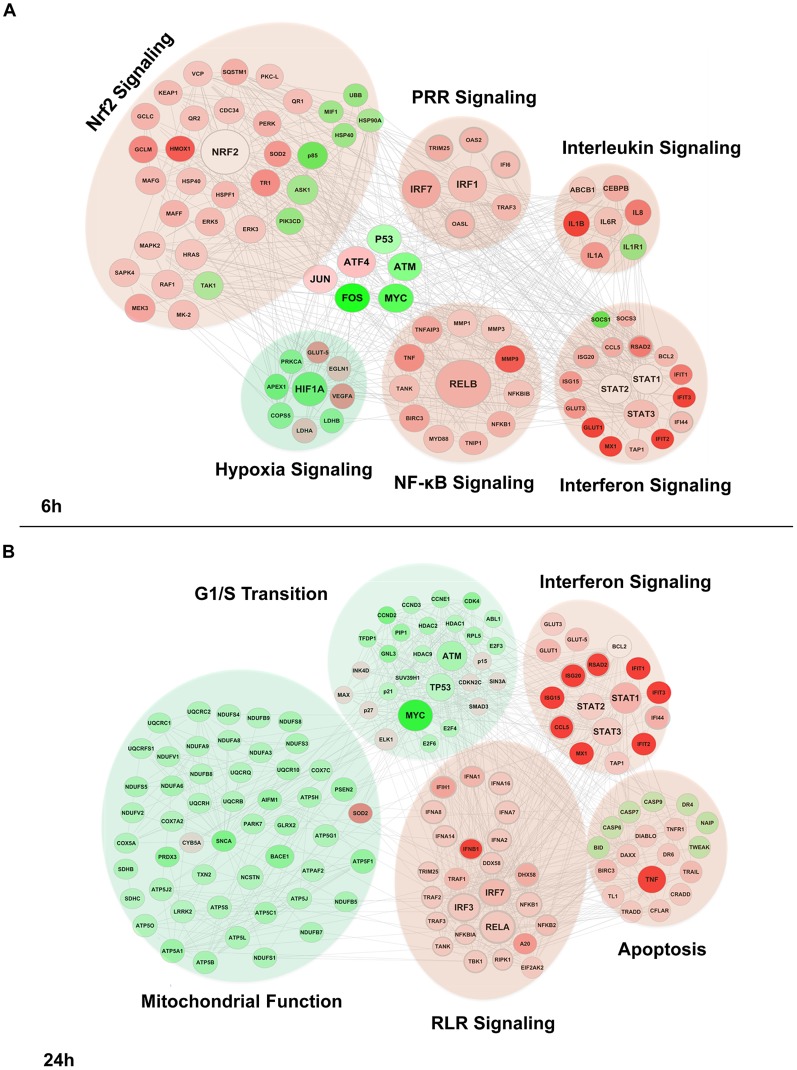
Figure 3. Functional characterization of genes differentially expressed by DENV2 infection.
Differentially expressed genes were subjected to Ingenuity Pathway Analysis for both 6 h (A) and 24 h (B) time points based on p-values (<0.001) and fold change ≥±1 (log2). Red represent genes induced by DENV, and green indicated genes downregulated by the virus; the intensity of the color is representative of the fold change. Larger circles indicate transcription factors. Genes enriched for a pathway are represented as a cloud.

