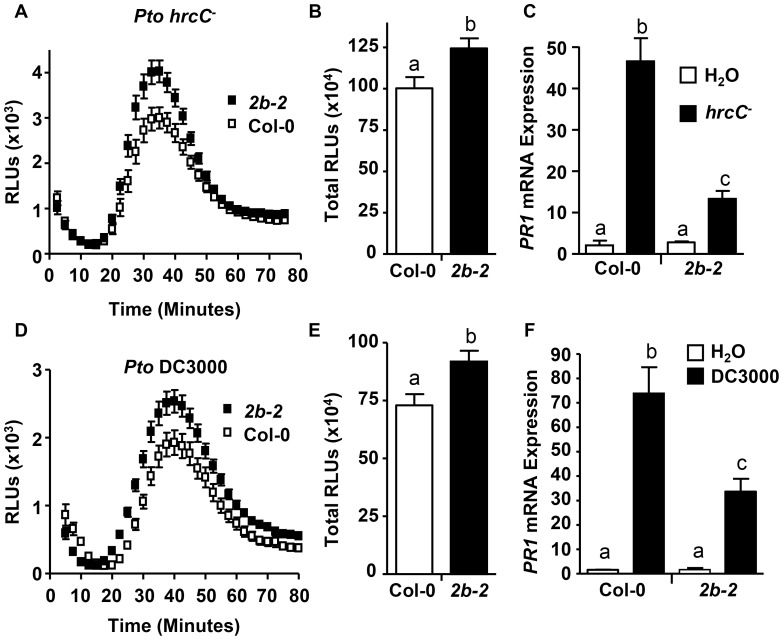
Figure 5. drp2b shows increased ROS and decreased PR1 mRNA to living Pto in a T3SS-independent manner.
(A) and (D) Time-course of ROS production in Col-0 (open symbol) and drp2b-2 (2b-2; filled symbol) in response to living (A) Pto hrcC- or (D) Pto DC3000 (OD600 = 0.1). (n = 32/genotype). (B) and (E) Compared to Col-0, total ROS production was significantly increased in drp2b-2 (2b-2) after elicitation with (B) Pto hrcC− (P<0.01) or (E) Pto DC3000 (P<0.007) based on values shown in (A) or (D), respectively. Relative Light Units, RLU. (C) and (F) Using qRT-PCR, PR1 mRNA levels were significantly reduced in drp2b-2 (black bars) compared to Col-0 (white bars) at 24 hr after infiltration with (C) Pto hrcC− (OD600 = 0.02) (P<0.045) or (F) Pto DC3000 (DC; OD600 = 0.02) (P<0.005). Infiltration with water (white bars) served as mock control. (n = 6/genotype and treatment). All experiments were done using five-to-six week old leaf tissue and repeated at least three independent times with similar results. Values are mean ± SE. Statistical analysis was done as in Fig. 1.

