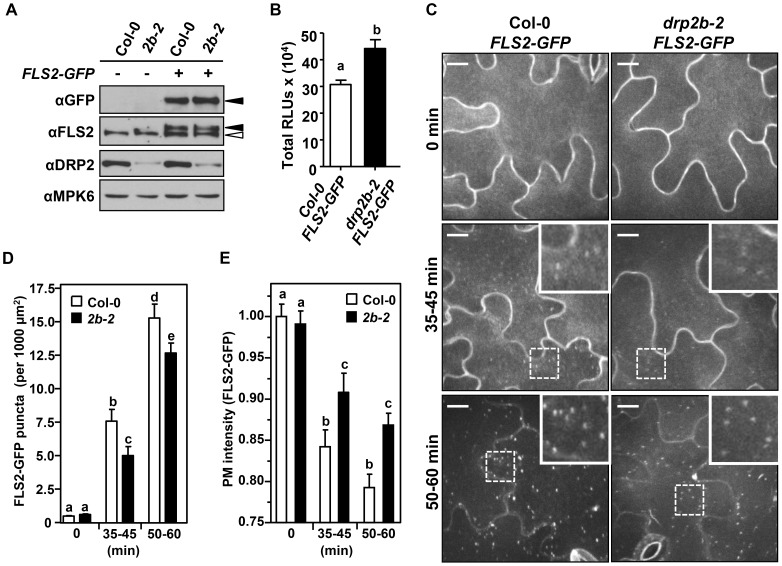
Figure 7. DRP2B is partially required for flg22-induced endocytosis of FLS2.
(A) Col-0 FLS2-GFP and drp2b-2 FLS2-GFP (2b-2) homozygous F4 seedlings expressed similar levels of both endogenous FLS2 and FLS2-GFP as shown by immunoblot analyses of total protein extracts. αFLS2 detected both native FLS2 (open arrow) and FLS2-GFP (closed arrow) while αGFP detected FLS2-GFP only (closed arrow). αDRP2 was used to confirm drp2b-2 mutants, and αMPK6 was used as a loading control. (B) In response to 1 µM flg22, total ROS production was elevated in drp2b-2 FLS2-GFP (black bar) compared to Col-0 FLS2-GFP (white bars) cotyledons (P<0.001). (n = 30 cotyledons/genotype). Relative Light Units, RLU. (C) Flg22-induced endocytosis of FLS2-GFP was not blocked in drp2b-2 cotyledons. Col-0 FLS2-GFP (Col-0) and drp2b-2 FLS2-GFP whole seedlings were treated with 1 µM flg22 to observe un-elicited (constitutive; 0 min) and ligand-induced (35–45, 50–60 min) endocytosis of FLS2-GFP by spinning disc confocal microscopy. Representative maximum-intensity projection images and zoomed insets of FLS2-GFP fluorescence are shown, with bright pixels corresponding to increased abundance of FLS2-GFP at a given location. Scale bars = 10 µm. (D) Quantification of FLS2-GFP in puncta at 0, 35–45 or 50–60 min after elicitation with 1 µM flg22 indicates that loss of DRP2B resulted in ∼20% decrease in flg22-stimulated endocytosis of FLS2-GFP (35–45 min, P = 0.0204; 50–60 min, P = 0.0396). No change in unstimulated accumulation of FLS2-GFP in puncta (P>0.05, 0 min) was observed. Images from two independent experiments were included in the analysis. (n = 44 to 67 images analyzed per genotype/treatment). (E) In drp2b-2 cotyledons, decreased accumulation of FLS2-GFP in puncta correlates with increased PM intensity of FLS2-GFP after elicitation with 1 µM flg22 relative to Col-0 (35–45 min, P = 0.0302; 50–60 min, P = 0.0001). No significant differences are observed in the PM intensity of FLS2-GFP in unstimulated Col-0 and drp2b-2 cotyledons (P>0.05, 0 min). Images from 2–3 independent experiments were included in the analysis. (n = 76–151 images analyzed per genotype/treatment). All experiments were repeated at least three independent times with similar results. Values are mean ± SE. Statistical analysis was done as in Fig. 1.

