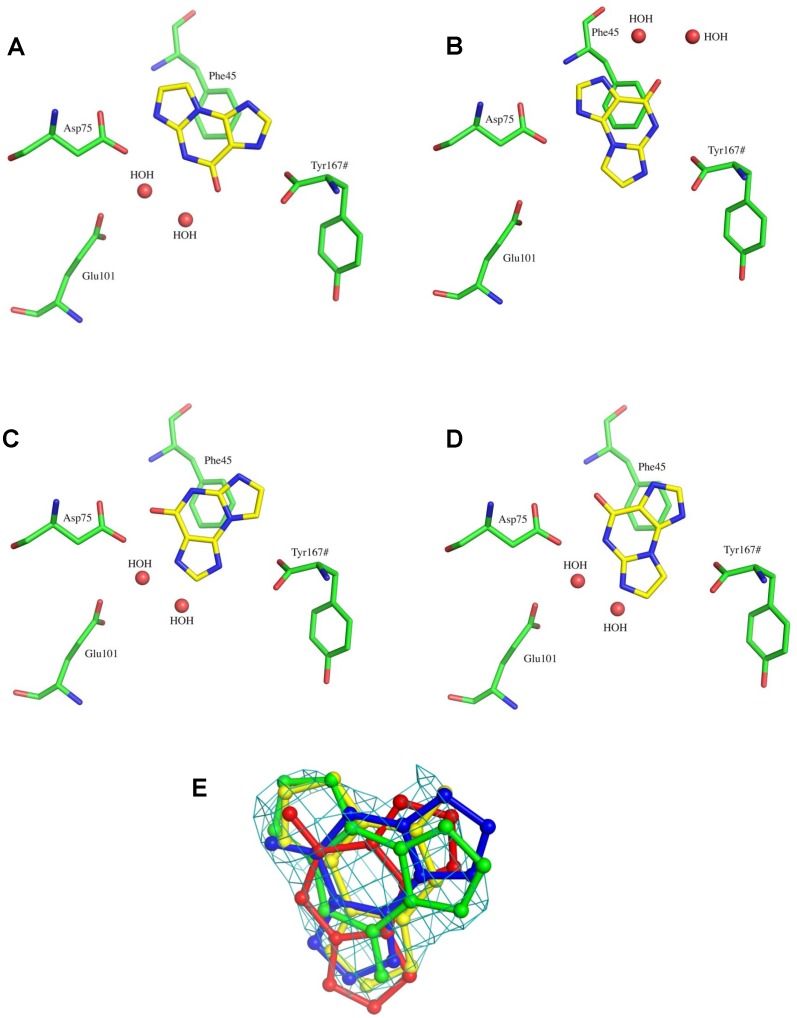
Figure 2. The active site of the L. helveticus PDT-1 complex, in the first (A), second (B), third (C) and fourth (D) conformations.
The important surrounding residues are shown in stick representation. The protein C atoms are colored in green, N in blue and O in red. The ligand C atoms are colored yellow, N in blue and O in red. Graphics were generated from the crystal structures with PyMOL [32]. (E) The Fo-Fc density for ethenoguanine in the active site of PDT contoured at 2.5 σ. The ligand, shown in ball and stick representation, is colored green, yellow, red and blue for the conformations respectively.

