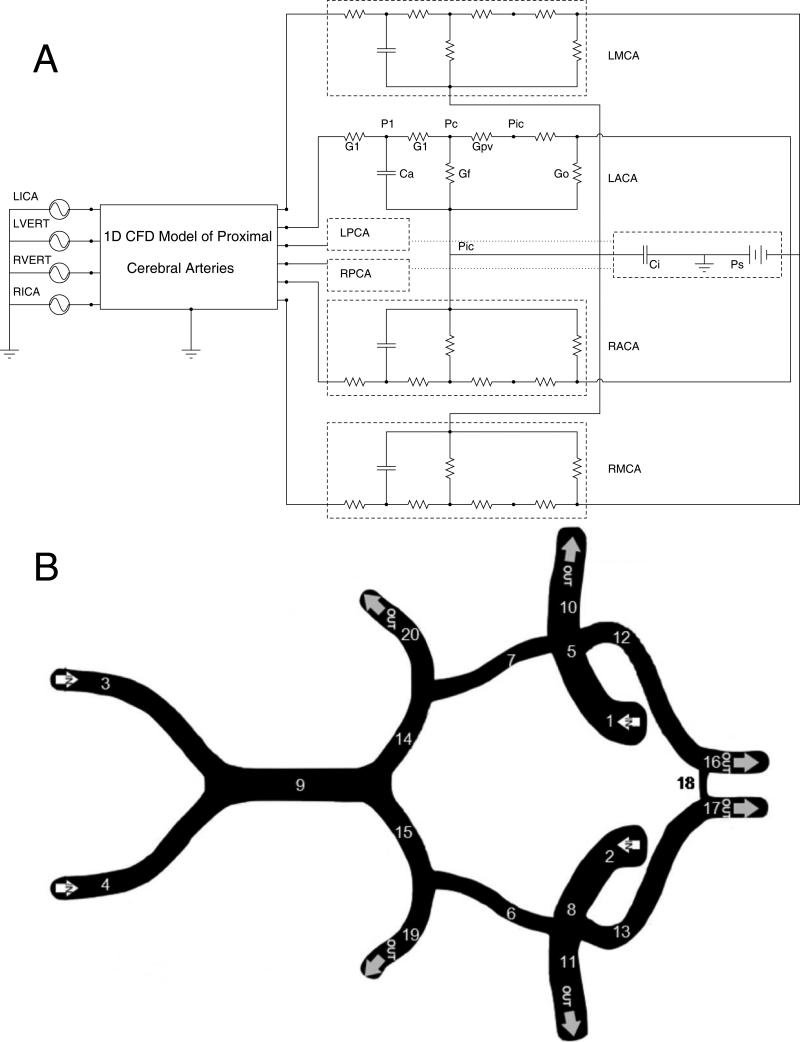
Figure 1.
A) A schematic diagram of the model of the cerebral vasculature. The input into the model is the flow through the left and right internal carotid and vertebral arteries (LICA, RICA, LVERT, RVERT). The flow is then computed through a 1 dimensional model of the circle of Willis. The six great vessels, the left and right middle, anterior, and posterior cerebral arteries all employ the Ursino autoregulatory models to represent the downstream vascular beds emanating from these vessels. In this diagram, G1 is the resistance of the capillary beds, Ca is the compliance of the vessel wall, Gf the conductance for the formation of CSF, Go the outflow conductance of CSF, Gpv is the conductance from the capillary to the location of collapse when the venous bed is modeled as a Starling resistor, Pic the intracranial pressure, Ci the intracranial compliance, and Ps the pressure of the sagittal sinus. B) The physiological diagram of the circle of Willis with the following segments represented in this model: 1 and 2 are the left and right internal carotid arteries. 3 and 4 are the left and right vertebral arteries. 5 and 8 are the distal segments of the left and right internal carotid arteries. 6 and 7 are the left and right posterior communicating arteries. 9 is the basilar artery. 10 and 11 are the left and right middle cerebral arteries. 12 and 13 are the left and right anterior cerebral arteries. 14 and 15 are the proximal segments of the left and right posterior cerebral arteries. 16 and 17 are the distal A2 segments of the left and right anterior cerebral arteries. 18 is the anterior communicating artery. 19 and 20 are the distal segments of the left and right posterior cerebral arteries. Common and external carotid arteries not shown.

