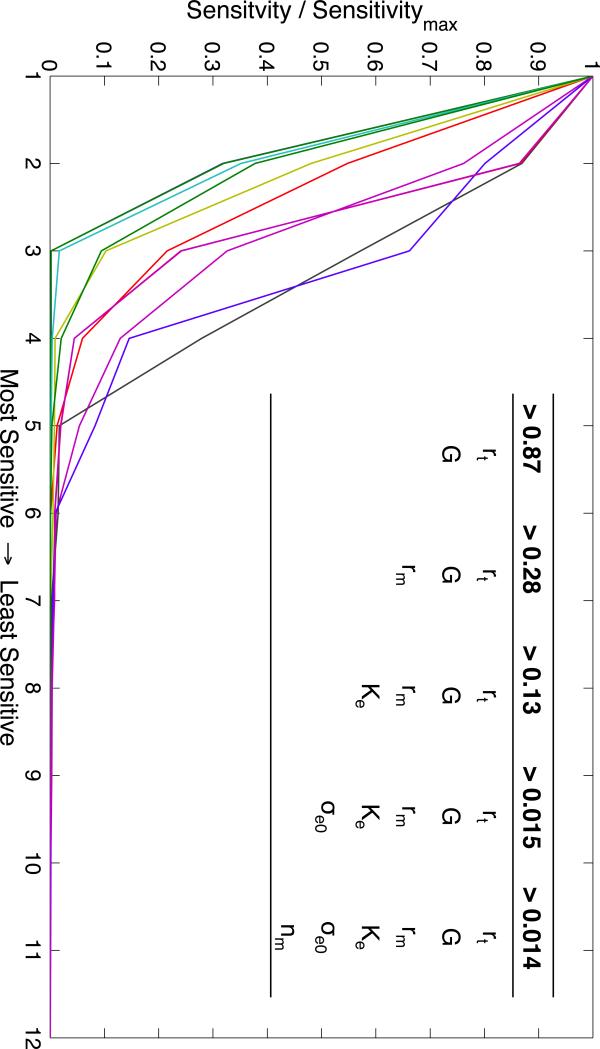
Figure 4.
Each line shows the sorted parameters sensitivities for each metric. The value of each parameter sensitivity is divided by the maximum sensitivity for that metric, giving the most sensitive a value of 1. The inset table shows the thresholds at which the number of parameters that have a greater relative sensitivity increases (e.g. rt, G, and rm are the only parameters that have a relative sensitivity greater than 0.28 for any metric).

