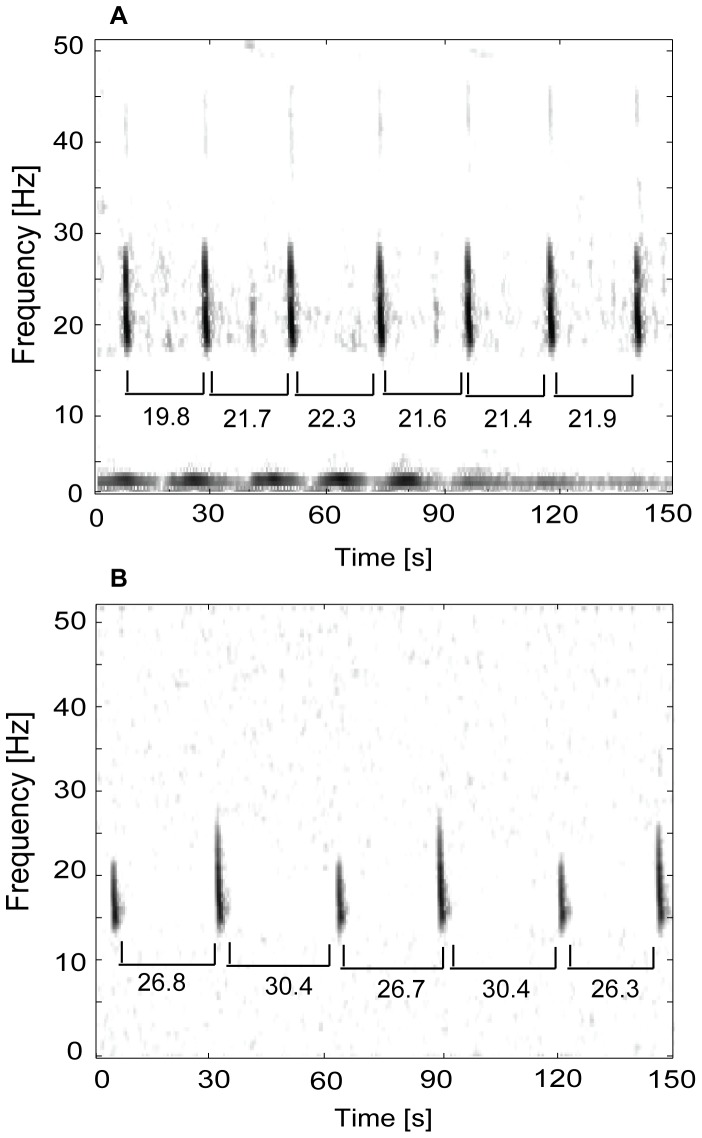
Figure 2. Spectrograms of fin whale singlet and doublet song.
The IPI (s) is shown below the pulses for each sequence. Panel A shows a song sequence with a single IPI recorded off Southern California in October 2002 and Panel B shows a song sequence with doublet IPIs from Hawaii in December 2002. Note that the timing of singlet IPIs is more variable than doublet IPIs. Spectrogram characteristics: 1-s FFT, 80% overlap. Occassionally the short IPI of the doublet pair is repeated between doublet sequences, most commonly off Southern California (not shown).

