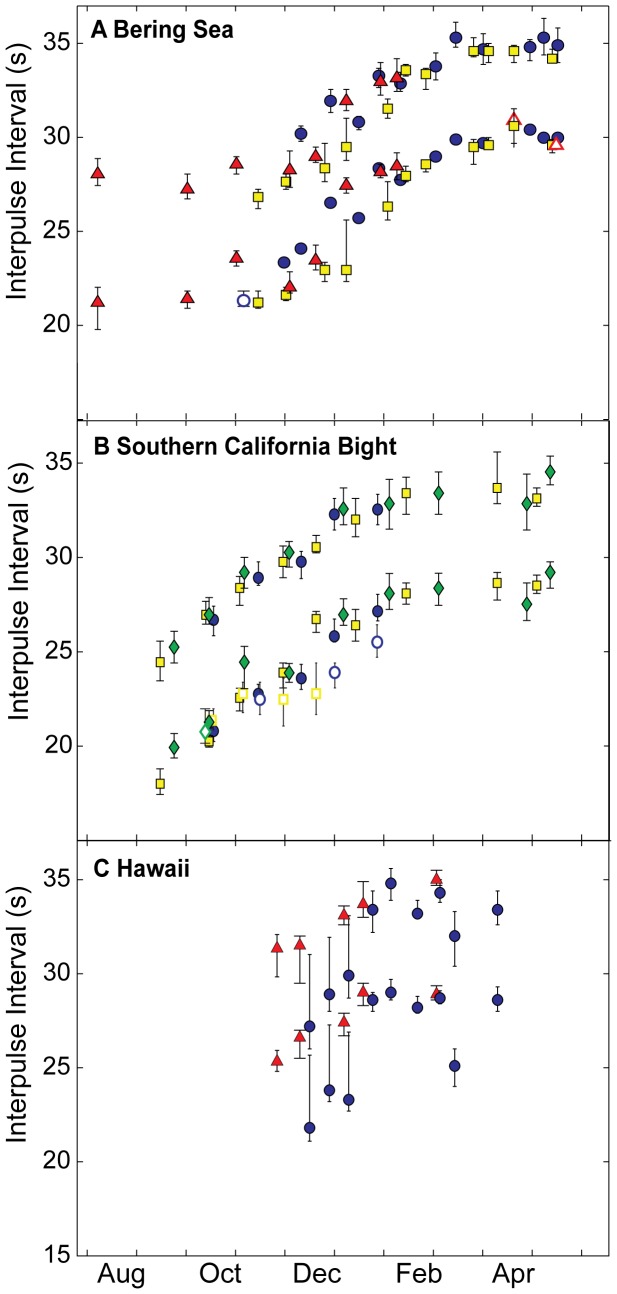
Figure 4. Median and 25% and 75% quartiles of fin whale interpulse intervals (IPI) by region.
Panel A shows fin whale IPIs from the Bering Sea, panel B from Southern California, and panel C from Hawaii. Both the short and long IPIs within a doublet pair are shown for each month unless only one interval was measured within a given month and site. Across all three panels each singing year is designated by a different symbol and color: 2000-01 —blue circles, 2001-02 — yellow squares, 2002-03 — green diamonds, and 2005-06 — red triangles. Open symbols represent months when singlet IPIs were also detected and measured. Location and recording details in Table 1.

