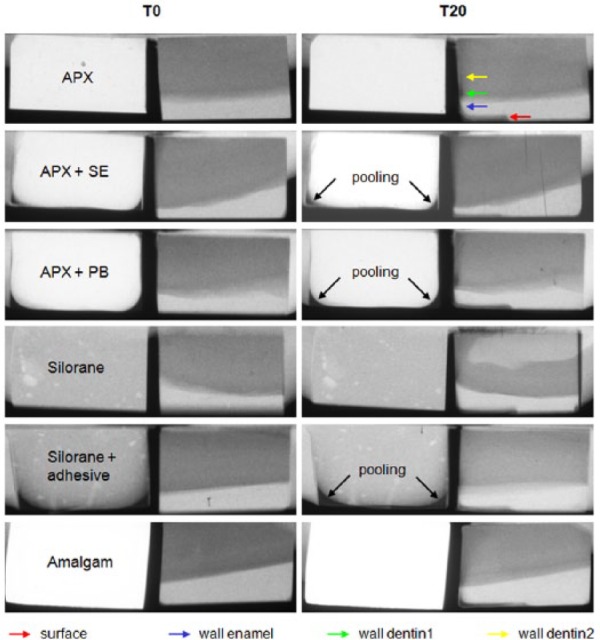
Figure 2.

Examples of T-WIM pictures of each restoration material at baseline (T0) and after 20 days (T20) with caries development. Measurement locations are pointed out by colored arrows. This figure is available in color online at http://jdr.sagepub.com.
